
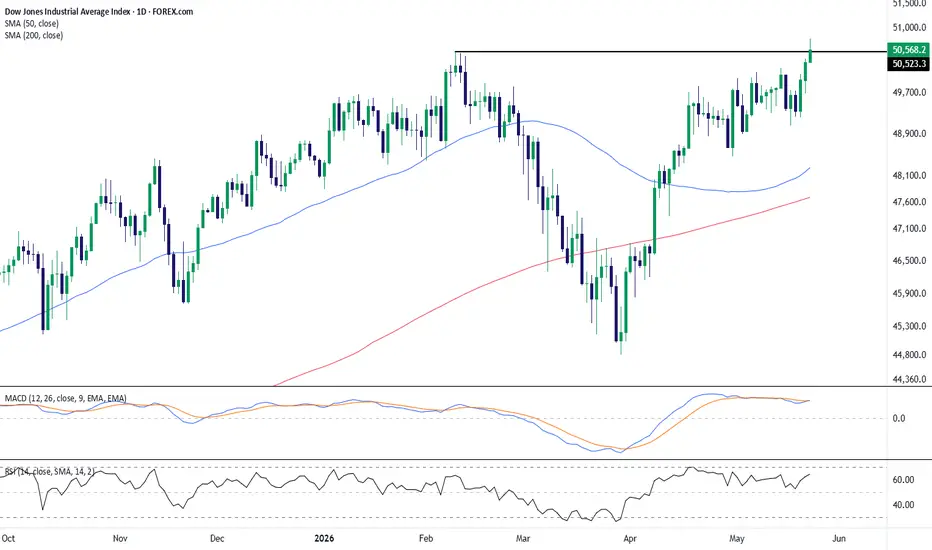
The Dow Jones Industrial Average is showing a constructive technical structure on the daily timeframe, with price pressing into a prior resistance zone near the recent highs. The horizontal level marked on the chart has acted as an important reference point, and the latest candle is attempting to move above that area with strong upside follow-through.
From a trend perspective, price remains above both the 50-day and 200-day simple moving averages, which supports a bullish broader bias. The 50-day SMA is also positioned above the 200-day SMA, reinforcing the view that the medium-term trend structure has improved following the sharp recovery from the March–April lows.
Momentum indicators are also supportive, though not without some caution. MACD is holding above the zero line, with the MACD line slightly above the signal line, suggesting positive momentum is still present. RSI has recovered into the upper half of its range and is moving toward stronger territory, but it has not yet reached extreme overbought conditions, leaving room for continued strength if buyers maintain control.
The key technical area to watch is the breakout zone around the previous high. Sustained price action above this level would confirm improving bullish momentum, while a rejection back below it could signal another consolidation phase. Overall, the chart presents a bullish-leaning setup, supported by trend alignment, momentum recovery, and a test of major resistance.
-MW
From a trend perspective, price remains above both the 50-day and 200-day simple moving averages, which supports a bullish broader bias. The 50-day SMA is also positioned above the 200-day SMA, reinforcing the view that the medium-term trend structure has improved following the sharp recovery from the March–April lows.
Momentum indicators are also supportive, though not without some caution. MACD is holding above the zero line, with the MACD line slightly above the signal line, suggesting positive momentum is still present. RSI has recovered into the upper half of its range and is moving toward stronger territory, but it has not yet reached extreme overbought conditions, leaving room for continued strength if buyers maintain control.
The key technical area to watch is the breakout zone around the previous high. Sustained price action above this level would confirm improving bullish momentum, while a rejection back below it could signal another consolidation phase. Overall, the chart presents a bullish-leaning setup, supported by trend alignment, momentum recovery, and a test of major resistance.
-MW

Feragatname
Bilgiler ve yayınlar, TradingView tarafından sağlanan veya onaylanan finansal, yatırım, alım satım veya diğer türden tavsiye veya öneriler anlamına gelmez ve teşkil etmez. Kullanım Koşulları bölümünde daha fazlasını okuyun.
Feragatname
Bilgiler ve yayınlar, TradingView tarafından sağlanan veya onaylanan finansal, yatırım, alım satım veya diğer türden tavsiye veya öneriler anlamına gelmez ve teşkil etmez. Kullanım Koşulları bölümünde daha fazlasını okuyun.