
Dow Jones (US30) Daily: Rally Followed by Negative Flag, Minimum
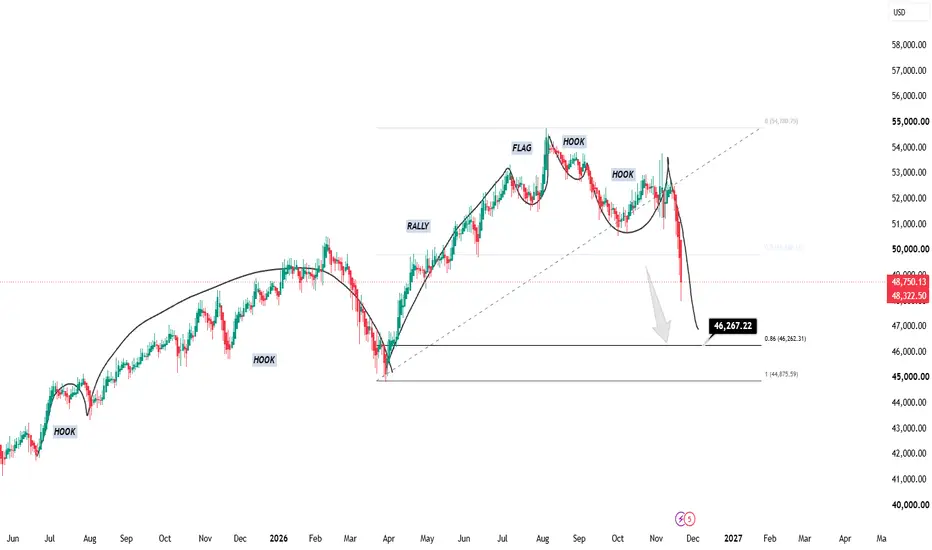
On the daily timeframe of the Dow Jones, we can see a clear "hoghogh" (salary/wage-like) structure on the chart, followed by a rally. In the end, the flag has moved back into the negative phase, and we can see the same pattern again.
The rally has completed about 86% of this final leg, which puts price at around 46,267. This is the minimum drop I expect from here, and after that we should see a jump to the upside.
Not financial advice. Always do your own research and manage your risk.🙂
The rally has completed about 86% of this final leg, which puts price at around 46,267. This is the minimum drop I expect from here, and after that we should see a jump to the upside.
Not financial advice. Always do your own research and manage your risk.🙂

Feragatname
Bilgiler ve yayınlar, TradingView tarafından sağlanan veya onaylanan finansal, yatırım, alım satım veya diğer türden tavsiye veya öneriler anlamına gelmez ve teşkil etmez. Kullanım Koşulları bölümünde daha fazlasını okuyun.
Feragatname
Bilgiler ve yayınlar, TradingView tarafından sağlanan veya onaylanan finansal, yatırım, alım satım veya diğer türden tavsiye veya öneriler anlamına gelmez ve teşkil etmez. Kullanım Koşulları bölümünde daha fazlasını okuyun.