
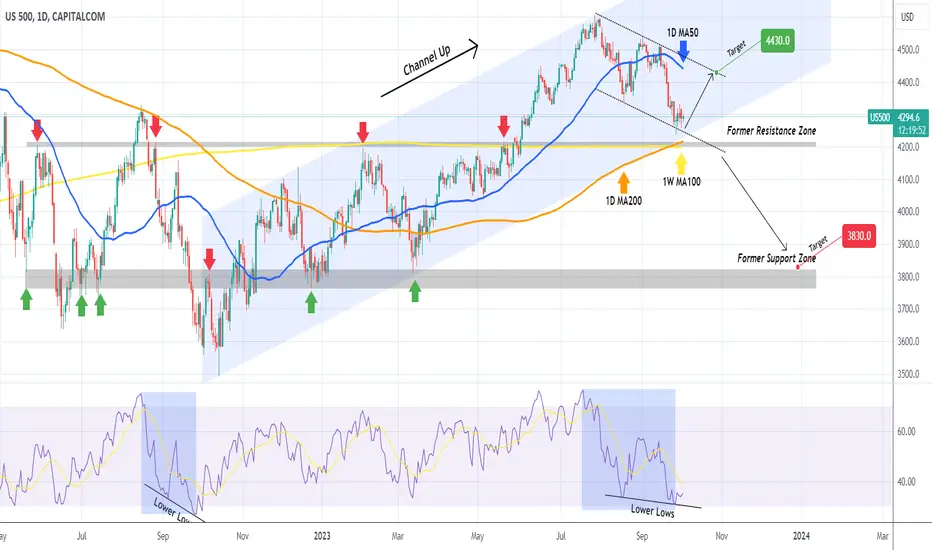
The S&P500 (SPX) is testing the bottom (Higher Lows trend-line) of the 12-month Channel Up pattern. It is vital for the uptrend that the following Support Cluster holds, as if broken, the next Demand/ Support Zone is seen considerably lower, in the low 3800s.
Back to the Support Zone. Besides the bottom of the Channel Up, we have the 1D MA200 (orange trend-line) moving parallel to that and has been unbroken since March 24. More importantly, the 1W MA100 (yellow trend-line) a former Resistance turned into Support after May's break-out, is marginally below the 1D MA200 and on a former Resistance Zone, which in the past 18 months, only broken twice.
As long as the price closes 1D candles above this critical Support cluster, we expect a short-term (at least) rise to test the top of the Channel Down and the 1D MA50 (blue trend-line) at 4430. If the Support fails, expect a greater and perhaps quicker/ more aggressive decline towards 3830 and the former Support Zone.
Notice how the 1D RSI pattern resembles the August - September 2022 correction.
-------------------------------------------------------------------------------
** Please LIKE 👍, FOLLOW ✅, SHARE 🙌 and COMMENT ✍ if you enjoy this idea! Also share your ideas and charts in the comments section below! **
-------------------------------------------------------------------------------
💸💸💸💸💸💸
👇 👇 👇 👇 👇 👇
Back to the Support Zone. Besides the bottom of the Channel Up, we have the 1D MA200 (orange trend-line) moving parallel to that and has been unbroken since March 24. More importantly, the 1W MA100 (yellow trend-line) a former Resistance turned into Support after May's break-out, is marginally below the 1D MA200 and on a former Resistance Zone, which in the past 18 months, only broken twice.
As long as the price closes 1D candles above this critical Support cluster, we expect a short-term (at least) rise to test the top of the Channel Down and the 1D MA50 (blue trend-line) at 4430. If the Support fails, expect a greater and perhaps quicker/ more aggressive decline towards 3830 and the former Support Zone.
Notice how the 1D RSI pattern resembles the August - September 2022 correction.
-------------------------------------------------------------------------------
** Please LIKE 👍, FOLLOW ✅, SHARE 🙌 and COMMENT ✍ if you enjoy this idea! Also share your ideas and charts in the comments section below! **
-------------------------------------------------------------------------------
💸💸💸💸💸💸
👇 👇 👇 👇 👇 👇

I trade Crypto, Forex, Indices & Commodities on PrimeXBT — all from one account with TradingView charts 👉 tradingshot.short.gy/PrimeXBT
I also use TradeNation for fixed spreads & zero commission 👉 tradingshot.short.gy/Tradenation
I also use TradeNation for fixed spreads & zero commission 👉 tradingshot.short.gy/Tradenation
Feragatname
Bilgiler ve yayınlar, TradingView tarafından sağlanan veya onaylanan finansal, yatırım, alım satım veya diğer türden tavsiye veya öneriler anlamına gelmez ve teşkil etmez. Kullanım Koşulları bölümünde daha fazlasını okuyun.
I trade Crypto, Forex, Indices & Commodities on PrimeXBT — all from one account with TradingView charts 👉 tradingshot.short.gy/PrimeXBT
I also use TradeNation for fixed spreads & zero commission 👉 tradingshot.short.gy/Tradenation
I also use TradeNation for fixed spreads & zero commission 👉 tradingshot.short.gy/Tradenation
Feragatname
Bilgiler ve yayınlar, TradingView tarafından sağlanan veya onaylanan finansal, yatırım, alım satım veya diğer türden tavsiye veya öneriler anlamına gelmez ve teşkil etmez. Kullanım Koşulları bölümünde daha fazlasını okuyun.