Uncertain S&P 500
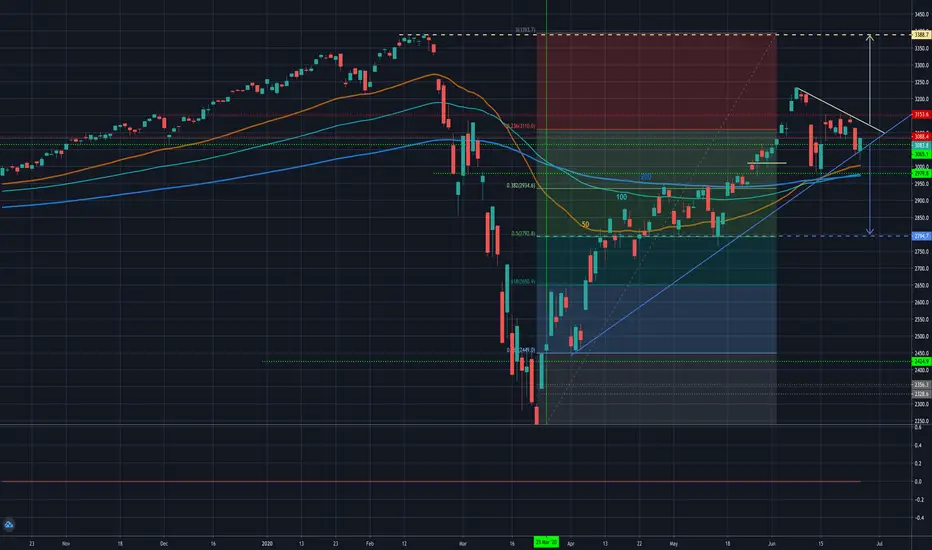
On my chart, you can see the triangle in which the price moves, the lower border of the triangle is indicated by blue colors and when it breaks down it can lead to a further drop in the price. And there is also the upper border of the triangle marked in yellow and when it is broken up, it will be a signal of further restoration of the market up to the previous maximum prices

Feragatname
Bilgiler ve yayınlar, TradingView tarafından sağlanan veya onaylanan finansal, yatırım, alım satım veya diğer türden tavsiye veya öneriler anlamına gelmez ve teşkil etmez. Kullanım Koşulları bölümünde daha fazlasını okuyun.
Feragatname
Bilgiler ve yayınlar, TradingView tarafından sağlanan veya onaylanan finansal, yatırım, alım satım veya diğer türden tavsiye veya öneriler anlamına gelmez ve teşkil etmez. Kullanım Koşulları bölümünde daha fazlasını okuyun.