

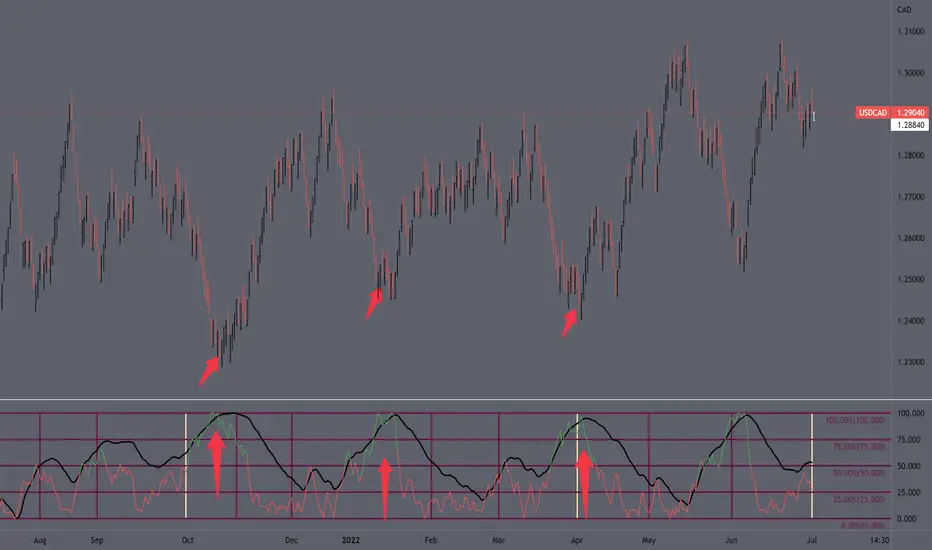
This was an interesting find using the EMA on Implied vol indicator. Looking at the technicals below the bar chart price has rallied 3 out of 3 times when this has happened during oct 2021 and April 2022. Along with the rallies have come the sell offs unlike the rallies the black EMA and the vix fix line track each other as the market sells off causing the red line to turn green and signal the next market rallies. I have still have to do back testing with it being this accurate it my be repainting.
Heres a link to my chart tradingview.com/chart/eGcjASRE/
Heres a link to my chart tradingview.com/chart/eGcjASRE/

Feragatname
Bilgiler ve yayınlar, TradingView tarafından sağlanan veya onaylanan finansal, yatırım, alım satım veya diğer türden tavsiye veya öneriler anlamına gelmez ve teşkil etmez. Kullanım Koşulları bölümünde daha fazlasını okuyun.
Feragatname
Bilgiler ve yayınlar, TradingView tarafından sağlanan veya onaylanan finansal, yatırım, alım satım veya diğer türden tavsiye veya öneriler anlamına gelmez ve teşkil etmez. Kullanım Koşulları bölümünde daha fazlasını okuyun.