

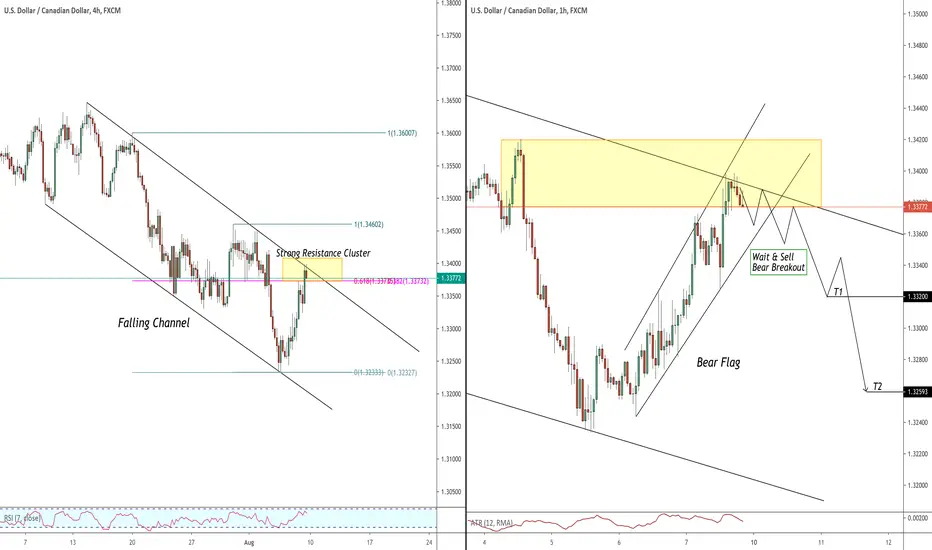
USDCAD is currently trading in a strong bearish trend.
during the last few days, we saw a nice pullback though.
friday's candle closed on a resistance line of a falling channel.
matching with fib.levels of the last legs and a horizontal structure on the left,
the price is now clearly trading within a strong structure resistance area.
to catch a bearish continuation I would suggest being focused on a bearish flag formation on 1H.
we need a 1H candle close below its support to initiate short.
target levels:
1.332
1.326
stop will be above the last flag's high.
in case of a bullish continuation above the underlined resistance cluster,
setup will be invalid.

✅My Telegram Channel: t.me/VasilyTrading
❗️YouTube Channel: youtube.com/c/VasilyTrader
✅ Facebook: facebook.com/VasilyTrading/
⭐ Get 100% Deposit Bonus: bit.ly/bestforexgoldbroker
❗️YouTube Channel: youtube.com/c/VasilyTrader
✅ Facebook: facebook.com/VasilyTrading/
⭐ Get 100% Deposit Bonus: bit.ly/bestforexgoldbroker
İlgili yayınlar
Feragatname
Bilgiler ve yayınlar, TradingView tarafından sağlanan veya onaylanan finansal, yatırım, alım satım veya diğer türden tavsiye veya öneriler anlamına gelmez ve teşkil etmez. Kullanım Koşulları bölümünde daha fazlasını okuyun.
✅My Telegram Channel: t.me/VasilyTrading
❗️YouTube Channel: youtube.com/c/VasilyTrader
✅ Facebook: facebook.com/VasilyTrading/
⭐ Get 100% Deposit Bonus: bit.ly/bestforexgoldbroker
❗️YouTube Channel: youtube.com/c/VasilyTrader
✅ Facebook: facebook.com/VasilyTrading/
⭐ Get 100% Deposit Bonus: bit.ly/bestforexgoldbroker
İlgili yayınlar
Feragatname
Bilgiler ve yayınlar, TradingView tarafından sağlanan veya onaylanan finansal, yatırım, alım satım veya diğer türden tavsiye veya öneriler anlamına gelmez ve teşkil etmez. Kullanım Koşulları bölümünde daha fazlasını okuyun.