

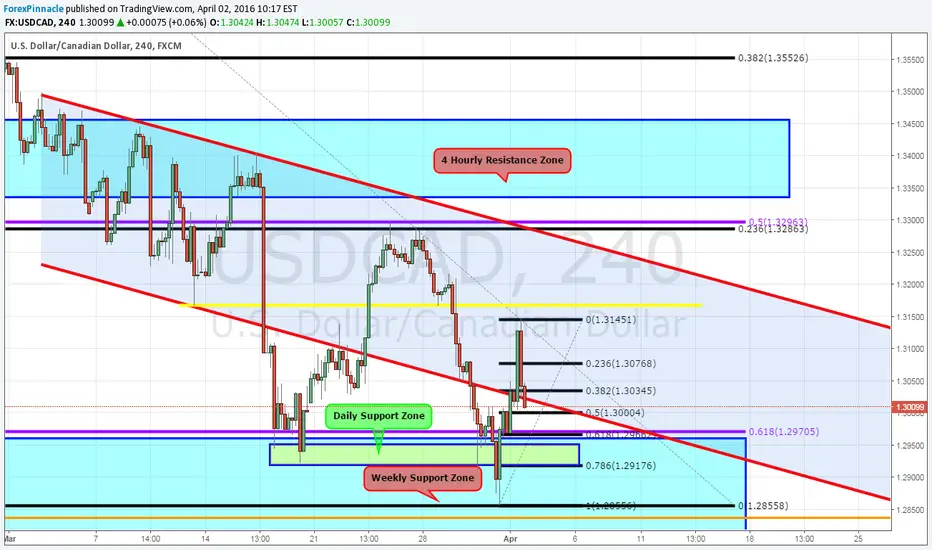
Looking at the 4 Hour chart USDCAD is in a clear downtrend and is currently breaking out of the downward channel to the downside for the 3/4 time. But these moves to the downside have so far been halted for a number of reasons. Namely because any attempt to move away from the 61.8 Fibonacci level (purple @ 1.29705) is entering, strong weekly support and now daily support has also formed. If USDCAD is to see more upside and potential reversal then I would expect buyers to come in around the two 61.8%% levels (black and purple). But be in now doubt that at the moment sellers are in full control with lower highs being consistently made on previous moves higher, followed by lower lows being posted. So be wary of how long a bounce higher could last for. Happy Trading :)

Feragatname
Bilgiler ve yayınlar, TradingView tarafından sağlanan veya onaylanan finansal, yatırım, alım satım veya diğer türden tavsiye veya öneriler anlamına gelmez ve teşkil etmez. Kullanım Koşulları bölümünde daha fazlasını okuyun.
Feragatname
Bilgiler ve yayınlar, TradingView tarafından sağlanan veya onaylanan finansal, yatırım, alım satım veya diğer türden tavsiye veya öneriler anlamına gelmez ve teşkil etmez. Kullanım Koşulları bölümünde daha fazlasını okuyun.