

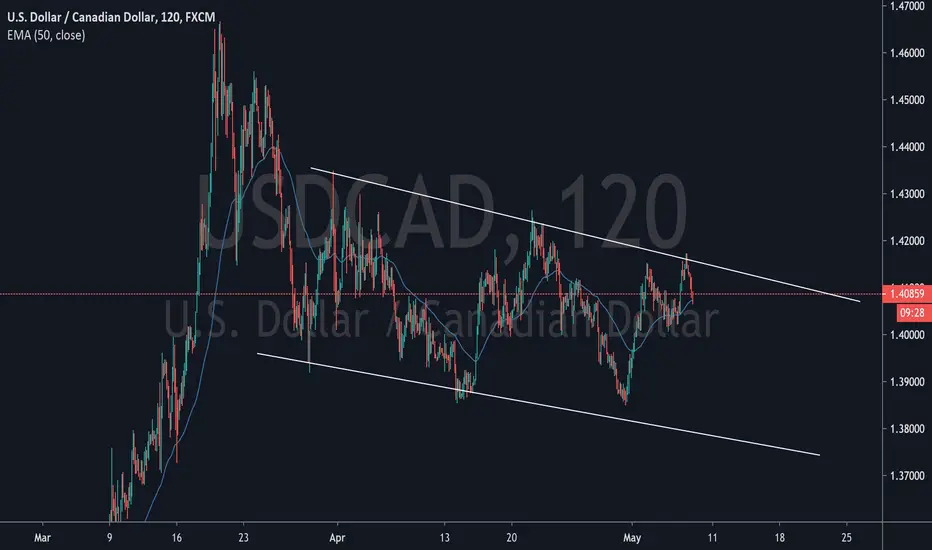
– Time = 2H
– Structure = Downtrend
– Pattern = Downtrend channel
– Tendency = Downtrend
– Monthly Candle retests Fibonacci resistance.
– 4hr Chart indicates an inverse hummer retested at the dynamic resistance level
– Price created a downtrend channel forming LH and LL.
– Hence the EMA 50 day is below the price, my analysis indicates a BEARISH MARKET
-----------------
Disclaimer: Forex trading and trading in other leveraged products involves a significant level of risk and is not suitable for all investors.
– Structure = Downtrend
– Pattern = Downtrend channel
– Tendency = Downtrend
– Monthly Candle retests Fibonacci resistance.
– 4hr Chart indicates an inverse hummer retested at the dynamic resistance level
– Price created a downtrend channel forming LH and LL.
– Hence the EMA 50 day is below the price, my analysis indicates a BEARISH MARKET
-----------------
Disclaimer: Forex trading and trading in other leveraged products involves a significant level of risk and is not suitable for all investors.
İşlem kapandı: hedefe ulaştı

Feragatname
Bilgiler ve yayınlar, TradingView tarafından sağlanan veya onaylanan finansal, yatırım, alım satım veya diğer türden tavsiye veya öneriler anlamına gelmez ve teşkil etmez. Kullanım Koşulları bölümünde daha fazlasını okuyun.
Feragatname
Bilgiler ve yayınlar, TradingView tarafından sağlanan veya onaylanan finansal, yatırım, alım satım veya diğer türden tavsiye veya öneriler anlamına gelmez ve teşkil etmez. Kullanım Koşulları bölümünde daha fazlasını okuyun.