

USDCAD Alert! — Smart Money + Elliott Wave + Price Action + Fib
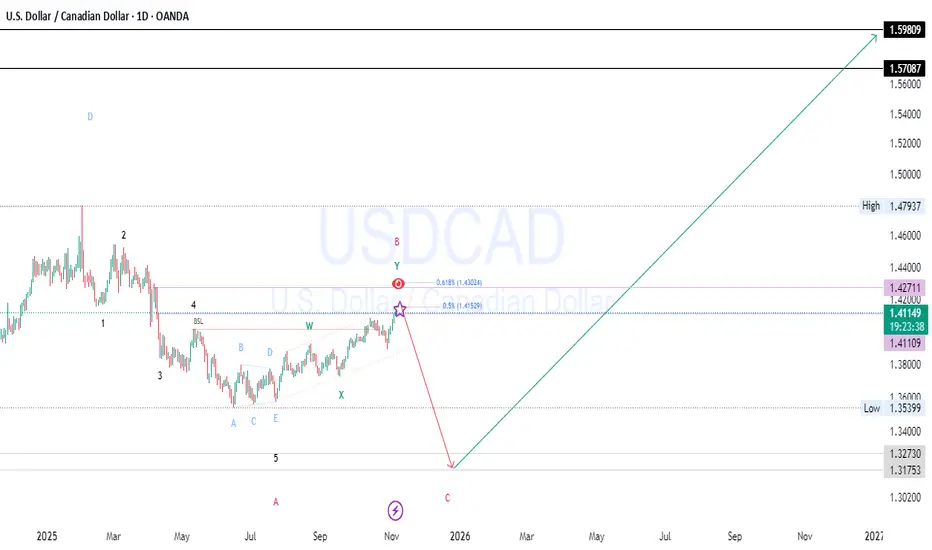
🚨USDCAD Wave C Correction Alert!
According to Wave Theory Confluence, we’re likely approaching the end of Wave B (Y) around the 1.4150–1.4300 zone — aligning with the 0.5–0.618 Fibonacci retracement levels. 📉
Price is showing exhaustion near this area with signs of liquidity grab (BSL hit) and smart money distribution, suggesting potential bearish reversal setups ahead. 🔍
Expecting Wave C to unfold next, targeting deeper downside correction before the next impulsive leg resumes.
📊 Key Confluences:
💡 Trade Idea: Watch for confirmation of bearish momentum and structure break before entering shorts toward 1.33–1.32 region.
Stay sharp — Wave C could be fast and decisive! ⚡
What’s your take, traders? 🤔
Do you think Wave C is about to drop hard or will bulls surprise us again? 🐻📉🐂
Drop your analysis 👇 — let’s see who nails the next big move! 🚀
#USDCAD #ForexAnalysis #ElliottWave #SmartMoneyConcepts #PriceAction #WaveTheory #ForexTrading #SwingTrade #Fibonacci #FXForecast #TechnicalAnalysis #TradeSetup #MarketStructure #USD #CAD #ForexCommunity
According to Wave Theory Confluence, we’re likely approaching the end of Wave B (Y) around the 1.4150–1.4300 zone — aligning with the 0.5–0.618 Fibonacci retracement levels. 📉
Price is showing exhaustion near this area with signs of liquidity grab (BSL hit) and smart money distribution, suggesting potential bearish reversal setups ahead. 🔍
Expecting Wave C to unfold next, targeting deeper downside correction before the next impulsive leg resumes.
📊 Key Confluences:
- Elliott Wave B completion zone
- Smart Money liquidity sweep
- Bearish structure shift forming
- Fibonacci rejection area
- Fundamentals still favor short-term CAD strength
💡 Trade Idea: Watch for confirmation of bearish momentum and structure break before entering shorts toward 1.33–1.32 region.
Stay sharp — Wave C could be fast and decisive! ⚡
What’s your take, traders? 🤔
Do you think Wave C is about to drop hard or will bulls surprise us again? 🐻📉🐂
Drop your analysis 👇 — let’s see who nails the next big move! 🚀
#USDCAD #ForexAnalysis #ElliottWave #SmartMoneyConcepts #PriceAction #WaveTheory #ForexTrading #SwingTrade #Fibonacci #FXForecast #TechnicalAnalysis #TradeSetup #MarketStructure #USD #CAD #ForexCommunity
İşlem aktif
USDCAD has already declined over 140 pips from our marked selling area, confirming the initial bearish reaction.
However, current structure and liquidity distribution suggest that the pair may still complete one more leg to the upside — a move likely designed to engineer liquidity above recent highs and trap late buyers.
This potential push could serve as the final liquidity grab before a massive 1000-pip downside move, aligning with higher-timeframe order flow and smart money distribution.
In summary, while short-term momentum remains mixed, we maintain a bearish macro bias once liquidity is taken from the upside.
Not
USDCAD has delivered a clean 300-pip decline from the liquidity zone identified in our initial outlook, confirming that the preceding advance functioned as an upside liquidity sweep rather than a directional reversal. Market structure continues to signal higher-timeframe distribution, with sell-side order flow dominant and recent price action reflecting corrective behavior rather than the formation of sustainable bullish structure. While brief consolidation or minor retracement may occur, these developments do not undermine the broader directional narrative. We maintain a clear bearish macro bias, with the expectation that the pair will continue unwinding toward deeper liquidity pools—aligning with our primary target of an extended 1,000-pip downside leg.
Not
USDCAD delivered a substantial move of approximately 600 pips, unfolding in line with the previously outlined market expectations. The pair respected key technical levels, with momentum building in the anticipated direction and follow-through confirming the strength of the setup. This move reflects sustained directional bias and effective market structure alignment, reinforcing the validity of the initial analysis and execution framework.
Not

Feragatname
Bilgiler ve yayınlar, TradingView tarafından sağlanan veya onaylanan finansal, yatırım, alım satım veya diğer türden tavsiye veya öneriler anlamına gelmez ve teşkil etmez. Kullanım Koşulları bölümünde daha fazlasını okuyun.
Feragatname
Bilgiler ve yayınlar, TradingView tarafından sağlanan veya onaylanan finansal, yatırım, alım satım veya diğer türden tavsiye veya öneriler anlamına gelmez ve teşkil etmez. Kullanım Koşulları bölümünde daha fazlasını okuyun.