USD/JPY (
 USDJPY) Daily: Long-Wick Indecision Candle At 200-EMA Highlights Potential Rebound Off 157.76 Support
### 🇺🇸/🇯🇵 U.S. Dollar / Japanese Yen (USDJPY) Daily Technical Framework (Ref: USDJPY_2026-08-04_08-32-51.png)
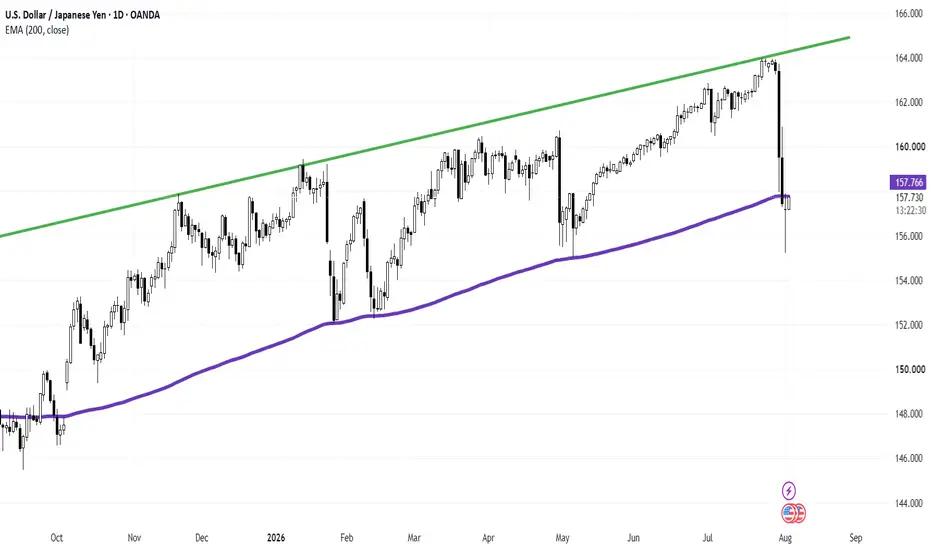
We are releasing a Daily (1D) technical update onUSDJPY following a violent multi-day sell-off originating from the channel resistance line (green top baseline near 164.000). The severe downside momentum has collided directly into the major institutional baseline, resulting in clear signs of sell-side exhaustion.
The currency pair is currently stabilizing at **157.643 (+0.28%)**, hovering precisely around its **200-period EMA (157.765)**.
---
### 🔍 Technical Architecture & Indecision Candle Analysis:
Our quantitative framework focuses on the structural significance of yesterday's candlestick pattern at a key moving average node:
1. **200-EMA Institutional Test (Purple Line):** After dropping vertically from the **164.000** peak, price action breached the **200-period EMA (157.765)** intraday, sweeping liquidity down toward lower support levels.
2. **Yesterday's Indecision Candle (Doji / Long Lower Wick):** Yesterday's daily session closed as a classic indecision candle (spinning top/Doji) featuring a significant lower wick. This proves that sell-side momentum encountered aggressive buy-side absorption precisely at the **157.765** dynamic support line, preventing a structural breakdown.
3. **Macro Ascending Channel Wall (Green Line):** The upper boundary of the macro channel continues to cap long-term upside, making the **157.765** level the central decision zone for medium-term bias.
---
### 🛣️ Strategic Operational Pathways:
* **Scenario A — Bullish Mean Reversion Rebound:** Holding above the **157.765** (200-EMA) baseline on a daily closing basis validates yesterday's indecision candle as a exhaustion pivot. This scenario triggers a corrective rally back toward intermediate supply targets at **160.000** and **162.000**.
* **Scenario B — Bearish Breakdown Extension:** A decisive daily candle close below yesterday's low would invalidate the 200-EMA support, opening downside exposure toward secondary structural support floors at **154.000** and **152.000**.
### 📊 Tactical Parameters Summary:
* **Current Bias:** Neutral / Bullish Rebound Defense at 200-EMA
* **Key Dynamic Support Anchor:** 157.765 (200-EMA)
* **Immediate Resistance Target:** 160.000
* **Secondary Overhead Target:** 162.000
* **Downside Breakdown Level:** 155.000
---
📊 **ChartPro Data**
*FX Market Microstructure, Dynamic EMA Anchors & Systematic Risk Management.*
⚠️ **Disclaimer:** For educational and informational purposes only. This active market study represents a personal trading framework and does not constitute financial or investment advice.
USDJPY) Daily: Long-Wick Indecision Candle At 200-EMA Highlights Potential Rebound Off 157.76 Support### 🇺🇸/🇯🇵 U.S. Dollar / Japanese Yen (
USDJPY) Daily Technical Framework (Ref: USDJPY_2026-08-04_08-32-51.png)We are releasing a Daily (1D) technical update on
USDJPY following a violent multi-day sell-off originating from the channel resistance line (green top baseline near 164.000). The severe downside momentum has collided directly into the major institutional baseline, resulting in clear signs of sell-side exhaustion.The currency pair is currently stabilizing at **157.643 (+0.28%)**, hovering precisely around its **200-period EMA (157.765)**.
---
### 🔍 Technical Architecture & Indecision Candle Analysis:
Our quantitative framework focuses on the structural significance of yesterday's candlestick pattern at a key moving average node:
1. **200-EMA Institutional Test (Purple Line):** After dropping vertically from the **164.000** peak, price action breached the **200-period EMA (157.765)** intraday, sweeping liquidity down toward lower support levels.
2. **Yesterday's Indecision Candle (Doji / Long Lower Wick):** Yesterday's daily session closed as a classic indecision candle (spinning top/Doji) featuring a significant lower wick. This proves that sell-side momentum encountered aggressive buy-side absorption precisely at the **157.765** dynamic support line, preventing a structural breakdown.
3. **Macro Ascending Channel Wall (Green Line):** The upper boundary of the macro channel continues to cap long-term upside, making the **157.765** level the central decision zone for medium-term bias.
---
### 🛣️ Strategic Operational Pathways:
* **Scenario A — Bullish Mean Reversion Rebound:** Holding above the **157.765** (200-EMA) baseline on a daily closing basis validates yesterday's indecision candle as a exhaustion pivot. This scenario triggers a corrective rally back toward intermediate supply targets at **160.000** and **162.000**.
* **Scenario B — Bearish Breakdown Extension:** A decisive daily candle close below yesterday's low would invalidate the 200-EMA support, opening downside exposure toward secondary structural support floors at **154.000** and **152.000**.
### 📊 Tactical Parameters Summary:
* **Current Bias:** Neutral / Bullish Rebound Defense at 200-EMA
* **Key Dynamic Support Anchor:** 157.765 (200-EMA)
* **Immediate Resistance Target:** 160.000
* **Secondary Overhead Target:** 162.000
* **Downside Breakdown Level:** 155.000
---
📊 **ChartPro Data**
*FX Market Microstructure, Dynamic EMA Anchors & Systematic Risk Management.*
⚠️ **Disclaimer:** For educational and informational purposes only. This active market study represents a personal trading framework and does not constitute financial or investment advice.

Feragatname
Bilgiler ve yayınlar, TradingView tarafından sağlanan veya onaylanan finansal, yatırım, alım satım veya diğer türden tavsiye veya öneriler anlamına gelmez ve teşkil etmez. Kullanım Koşulları bölümünde daha fazlasını okuyun.
Feragatname
Bilgiler ve yayınlar, TradingView tarafından sağlanan veya onaylanan finansal, yatırım, alım satım veya diğer türden tavsiye veya öneriler anlamına gelmez ve teşkil etmez. Kullanım Koşulları bölümünde daha fazlasını okuyun.