

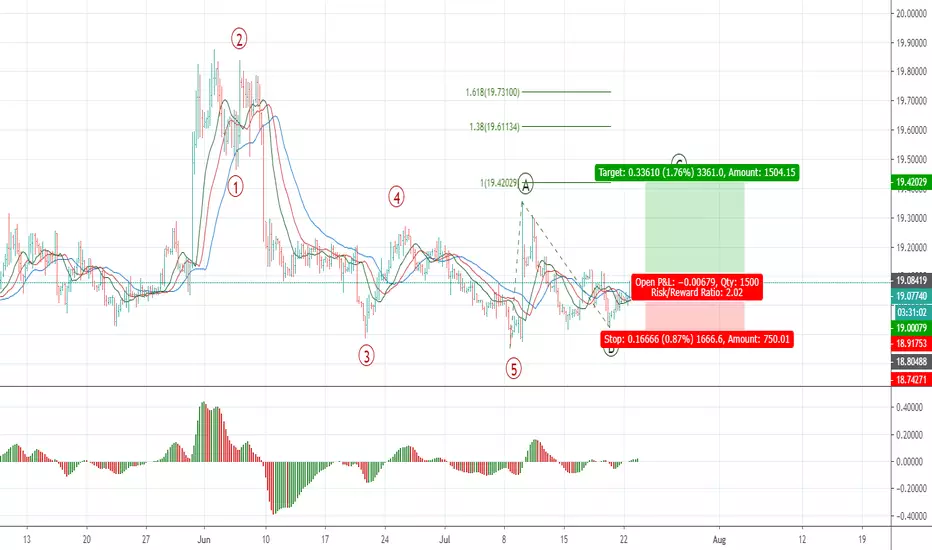
On the H4 chart of USDMXN, the price has formed a promising buy fractal above the balance MAs with AO indicator over the zero line. This signal is supported by Elliott wave structure: with high probability, we are moving in an ABC corrective zigzag, more accurately, in wave C. This gives me an idea to go long using levels that are marked on the chart.

Feragatname
Bilgiler ve yayınlar, TradingView tarafından sağlanan veya onaylanan finansal, yatırım, alım satım veya diğer türden tavsiye veya öneriler anlamına gelmez ve teşkil etmez. Kullanım Koşulları bölümünde daha fazlasını okuyun.
Feragatname
Bilgiler ve yayınlar, TradingView tarafından sağlanan veya onaylanan finansal, yatırım, alım satım veya diğer türden tavsiye veya öneriler anlamına gelmez ve teşkil etmez. Kullanım Koşulları bölümünde daha fazlasını okuyun.