

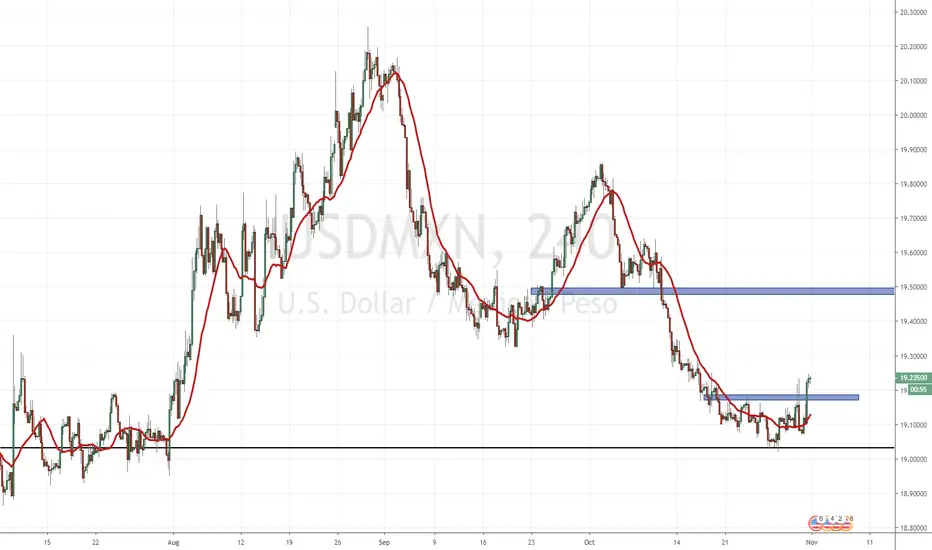
USDMXN was in a downtrend on the 4 hour chart with lower highs and lower lows. We then reached a very big support zone close to the 19.00 zone where we began to lose steam.
No more further lower highs and lower lows. We have now confirmed a higher low with a higher high break and close above the head and shoulders neckline.
The break was strong as you can see by the candle body. Target would be the flip zone near 19.50.
Do be wary of the 19.34 zone see how price reacts there.
No more further lower highs and lower lows. We have now confirmed a higher low with a higher high break and close above the head and shoulders neckline.
The break was strong as you can see by the candle body. Target would be the flip zone near 19.50.
Do be wary of the 19.34 zone see how price reacts there.

Feragatname
Bilgiler ve yayınlar, TradingView tarafından sağlanan veya onaylanan finansal, yatırım, alım satım veya diğer türden tavsiye veya öneriler anlamına gelmez ve teşkil etmez. Kullanım Koşulları bölümünde daha fazlasını okuyun.
Feragatname
Bilgiler ve yayınlar, TradingView tarafından sağlanan veya onaylanan finansal, yatırım, alım satım veya diğer türden tavsiye veya öneriler anlamına gelmez ve teşkil etmez. Kullanım Koşulları bölümünde daha fazlasını okuyun.