
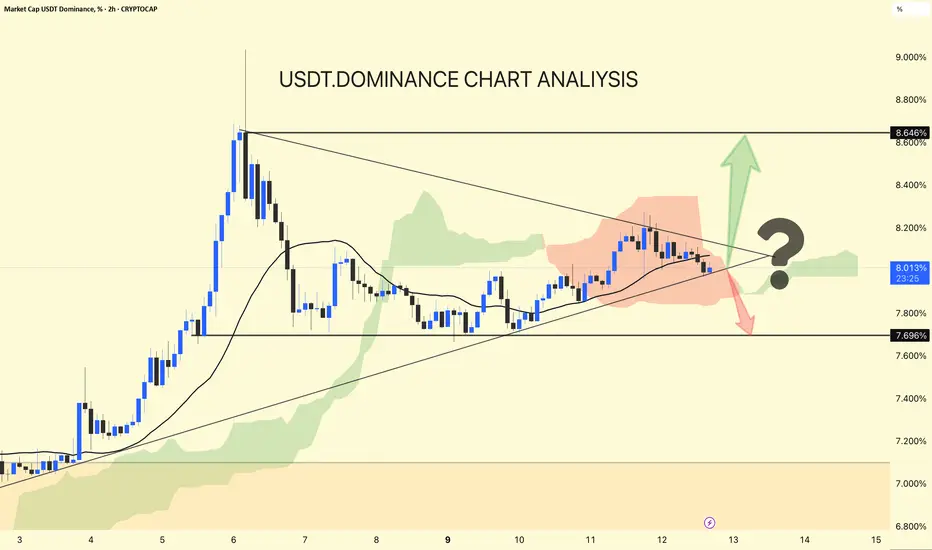
USDT Dominance – 2H Chart Analysis
USDT.D is trading inside a tightening triangle structure between rising support and descending resistance, currently around 8.02%. This is a key compression zone — breakout here will likely drive the next major move in the crypto market.
Support: 7.96% – 7.70%
Resistance: 8.20%
Major Resistance: 8.64%
→ Liquidity moving into stablecoins
→ Likely pressure on BTC & Altcoins
→ Potential market pullback
→ Capital flowing back into crypto
→ Bullish momentum for BTC & Alts
→ Possible relief rally across the market
⚠️ Watch dominance closely — it often moves before price reacts.
USDT.D is trading inside a tightening triangle structure between rising support and descending resistance, currently around 8.02%. This is a key compression zone — breakout here will likely drive the next major move in the crypto market.
Support: 7.96% – 7.70%
Resistance: 8.20%
Major Resistance: 8.64%
→ Liquidity moving into stablecoins
→ Likely pressure on BTC & Altcoins
→ Potential market pullback
→ Capital flowing back into crypto
→ Bullish momentum for BTC & Alts
→ Possible relief rally across the market
⚠️ Watch dominance closely — it often moves before price reacts.

İlgili yayınlar
Feragatname
Bilgiler ve yayınlar, TradingView tarafından sağlanan veya onaylanan finansal, yatırım, alım satım veya diğer türden tavsiye veya öneriler anlamına gelmez ve teşkil etmez. Kullanım Koşulları bölümünde daha fazlasını okuyun.
İlgili yayınlar
Feragatname
Bilgiler ve yayınlar, TradingView tarafından sağlanan veya onaylanan finansal, yatırım, alım satım veya diğer türden tavsiye veya öneriler anlamına gelmez ve teşkil etmez. Kullanım Koşulları bölümünde daha fazlasını okuyun.