
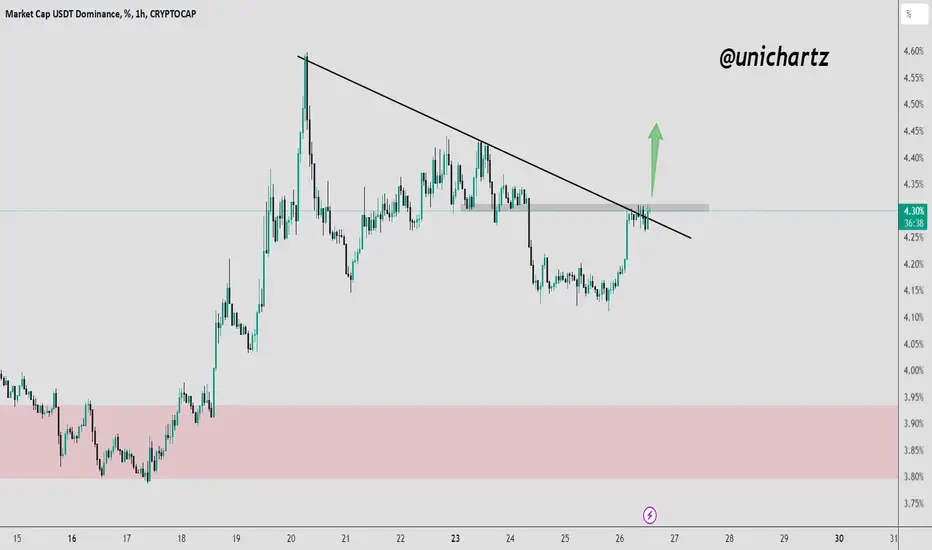
USDT.D has recently broken out of a falling wedge pattern, indicating a potential shift in momentum. The price is currently testing a critical resistance zone near 4.30%. A breakout above this level could signal further dominance for USDT, suggesting risk aversion in the crypto market.
If the resistance holds, a pullback toward the 4.20% support zone is likely. However, a confirmed breakout could lead to a continuation of the upward trend, potentially targeting the 4.40% level.
DYOR, NFA
If the resistance holds, a pullback toward the 4.20% support zone is likely. However, a confirmed breakout could lead to a continuation of the upward trend, potentially targeting the 4.40% level.
DYOR, NFA

Daily Free Signals :bit.ly/UnichartzAlpha
Register on Bitunix and trade with me: 👇
bitunix.com/register?vipCode=coEA
Register on Bitunix and trade with me: 👇
bitunix.com/register?vipCode=coEA
Feragatname
Bilgiler ve yayınlar, TradingView tarafından sağlanan veya onaylanan finansal, yatırım, alım satım veya diğer türden tavsiye veya öneriler anlamına gelmez ve teşkil etmez. Kullanım Koşulları bölümünde daha fazlasını okuyun.
Daily Free Signals :bit.ly/UnichartzAlpha
Register on Bitunix and trade with me: 👇
bitunix.com/register?vipCode=coEA
Register on Bitunix and trade with me: 👇
bitunix.com/register?vipCode=coEA
Feragatname
Bilgiler ve yayınlar, TradingView tarafından sağlanan veya onaylanan finansal, yatırım, alım satım veya diğer türden tavsiye veya öneriler anlamına gelmez ve teşkil etmez. Kullanım Koşulları bölümünde daha fazlasını okuyun.