
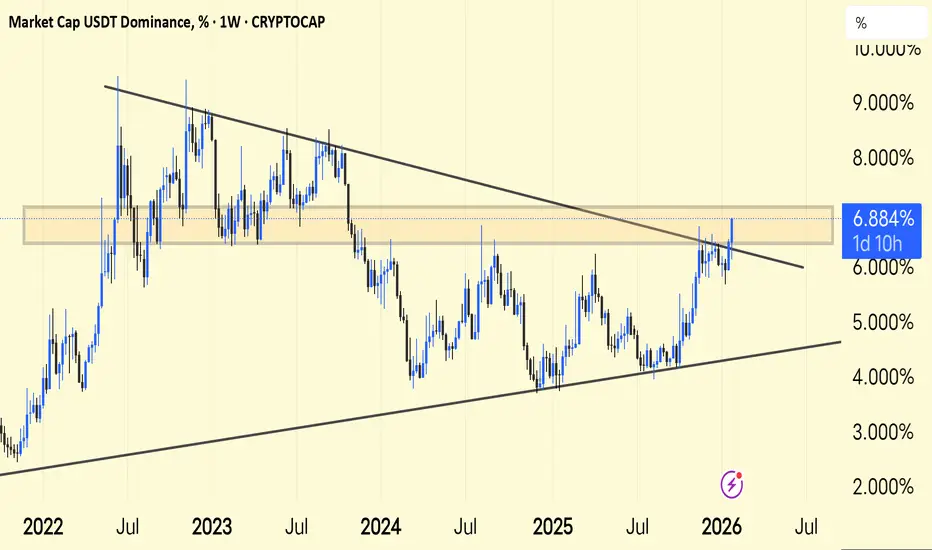
USDT.D — Weekly Chart |
• USDT dominance trading around 6.88%
• Price pushing toward descending trendline resistance
• Holding above key range support zone
• A clean breakout could signal risk-off / consolidation phase
• Rejection here may favor altcoin continuation
Market at an inflection point — watch the trendline closely

İlgili yayınlar
Feragatname
Bilgiler ve yayınlar, TradingView tarafından sağlanan veya onaylanan finansal, yatırım, alım satım veya diğer türden tavsiye veya öneriler anlamına gelmez ve teşkil etmez. Kullanım Koşulları bölümünde daha fazlasını okuyun.
İlgili yayınlar
Feragatname
Bilgiler ve yayınlar, TradingView tarafından sağlanan veya onaylanan finansal, yatırım, alım satım veya diğer türden tavsiye veya öneriler anlamına gelmez ve teşkil etmez. Kullanım Koşulları bölümünde daha fazlasını okuyun.