
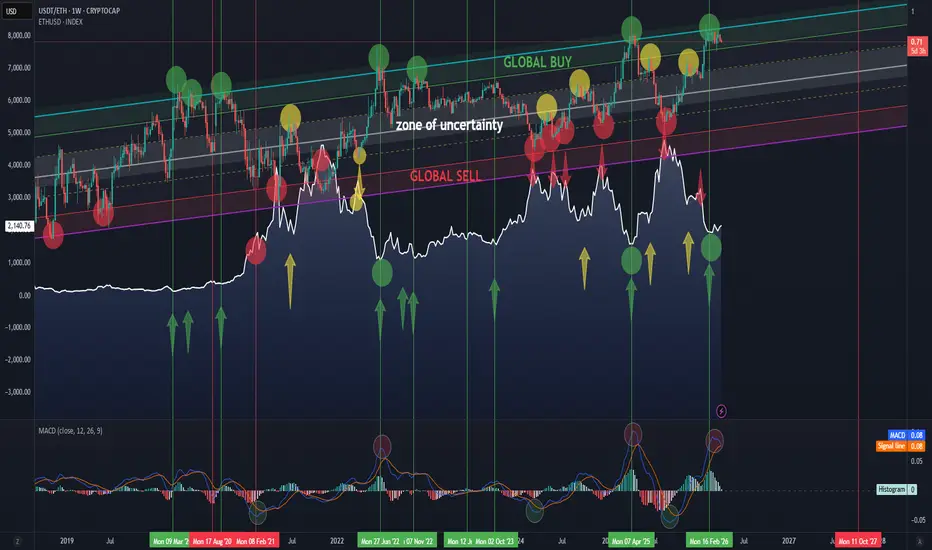
The chart speaks for itself.
USDT/ETH is shown on top, with ETH below for behavioral comparison.
Global buy and sell zones are clearly marked.
MACD is included to help identify the current market phase and understand where we are within the cycle.
And if Trump says everything is “super bad” — isn’t that actually a good buying opportunity?

İlgili yayınlar
Feragatname
Bilgiler ve yayınlar, TradingView tarafından sağlanan veya onaylanan finansal, yatırım, alım satım veya diğer türden tavsiye veya öneriler anlamına gelmez ve teşkil etmez. Kullanım Koşulları bölümünde daha fazlasını okuyun.
İlgili yayınlar
Feragatname
Bilgiler ve yayınlar, TradingView tarafından sağlanan veya onaylanan finansal, yatırım, alım satım veya diğer türden tavsiye veya öneriler anlamına gelmez ve teşkil etmez. Kullanım Koşulları bölümünde daha fazlasını okuyun.