

Unum flash note on the USDZAR from our Trading Desk analyst, Lester Davids.
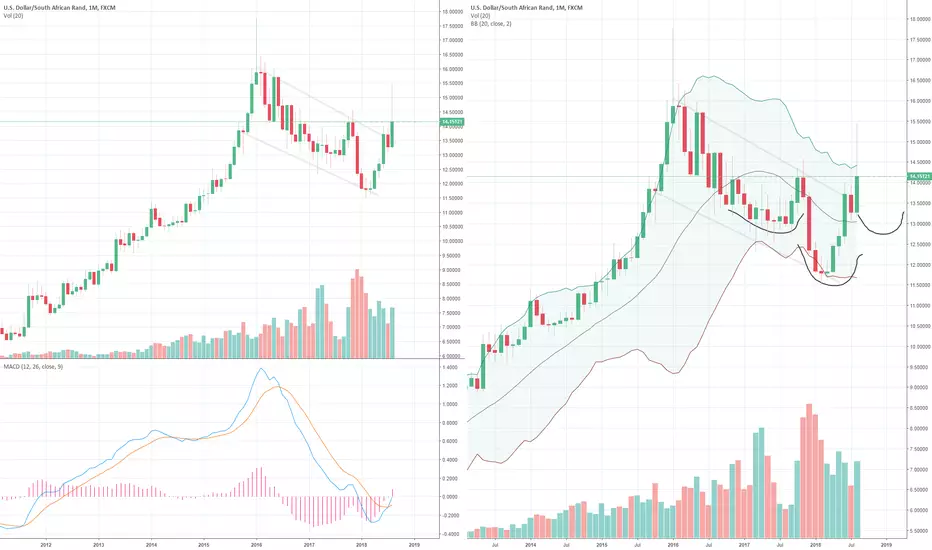
Chart 1: USDZAR: We currently trade just below the R14.25 resistance, with the Rand having gained on a weaker USD. The monthly chart shows this to be the top of the bull flag/channel.
Chart 2: Another view (again the monthly chart), shows the potential start of a "right shoulder" of a long term inverse H&S formation.
support and resistance levels from the bank analysts (Investec) this morning confirm these ranges (R1 14.2430, S1 14.15)
Chart 1: USDZAR: We currently trade just below the R14.25 resistance, with the Rand having gained on a weaker USD. The monthly chart shows this to be the top of the bull flag/channel.
Chart 2: Another view (again the monthly chart), shows the potential start of a "right shoulder" of a long term inverse H&S formation.
support and resistance levels from the bank analysts (Investec) this morning confirm these ranges (R1 14.2430, S1 14.15)

Feragatname
Bilgiler ve yayınlar, TradingView tarafından sağlanan veya onaylanan finansal, yatırım, alım satım veya diğer türden tavsiye veya öneriler anlamına gelmez ve teşkil etmez. Kullanım Koşulları bölümünde daha fazlasını okuyun.
Feragatname
Bilgiler ve yayınlar, TradingView tarafından sağlanan veya onaylanan finansal, yatırım, alım satım veya diğer türden tavsiye veya öneriler anlamına gelmez ve teşkil etmez. Kullanım Koşulları bölümünde daha fazlasını okuyun.