
Monthly chart already Published
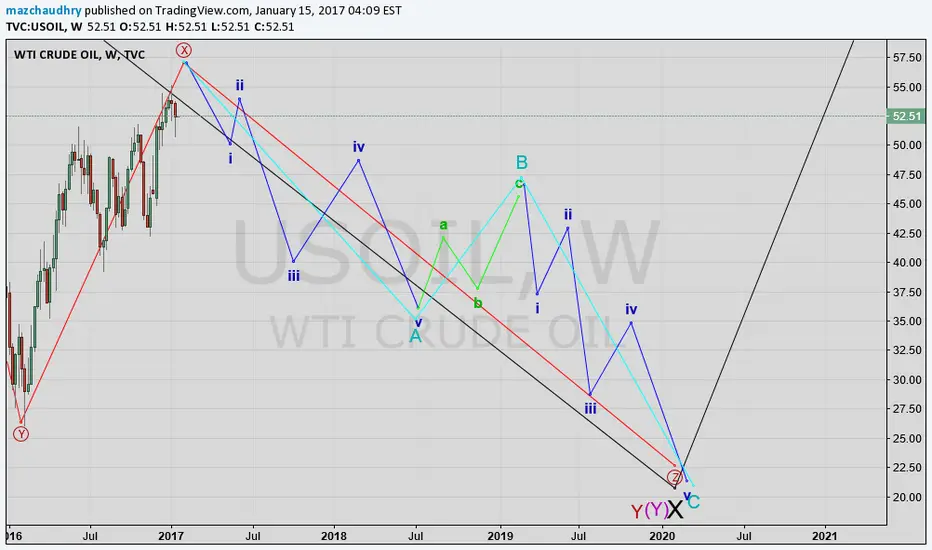
Here is my Weekly chart with Bit more explaining the short wave .
Short From 56.50 till 20.00 will be in ABC Formation ( As it is a Corrective Pattern )
Further division of ABC as bellow :
A= 12345
B= abc
C = 12345
Trade Plan ::
Lets wait for the Completion of X at 56.50
I will wait for (i)of A to complete
(ii) of A will be a Pullback there after a Congestion
I am going to enter into short trade at start of (iii)of A
many happy green pips to you all
Elliot Wave By mazchaudhry
Trade at your own Risk .

İlgili yayınlar
Feragatname
Bilgiler ve yayınlar, TradingView tarafından sağlanan veya onaylanan finansal, yatırım, alım satım veya diğer türden tavsiye veya öneriler anlamına gelmez ve teşkil etmez. Kullanım Koşulları bölümünde daha fazlasını okuyun.
İlgili yayınlar
Feragatname
Bilgiler ve yayınlar, TradingView tarafından sağlanan veya onaylanan finansal, yatırım, alım satım veya diğer türden tavsiye veya öneriler anlamına gelmez ve teşkil etmez. Kullanım Koşulları bölümünde daha fazlasını okuyun.