
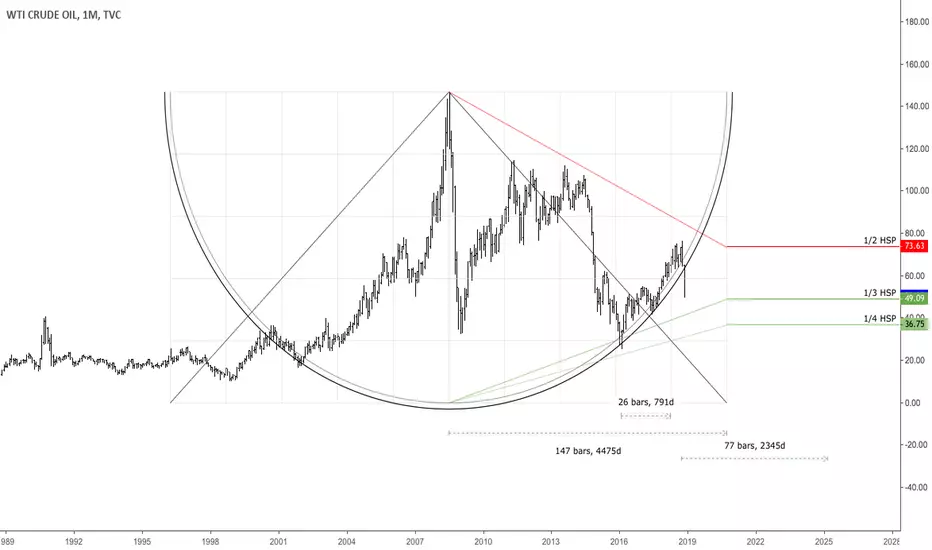
This is a monthly chart of USOIL with time cycles from important tops and bottoms. As shown in the chart, the current decline in oil started after 26 monthly bars since the bottom of $26 and around the 1/2 price area from highest selling price. Possible major pivot around the $48 area, which is the 1/3 of highest selling price of oil. If that goes, the next important area is the 1/4 of highest selling price around $36. It seems reasonable to look for long-term pivot around these price areas.

Feragatname
Bilgiler ve yayınlar, TradingView tarafından sağlanan veya onaylanan finansal, yatırım, alım satım veya diğer türden tavsiye veya öneriler anlamına gelmez ve teşkil etmez. Kullanım Koşulları bölümünde daha fazlasını okuyun.
Feragatname
Bilgiler ve yayınlar, TradingView tarafından sağlanan veya onaylanan finansal, yatırım, alım satım veya diğer türden tavsiye veya öneriler anlamına gelmez ve teşkil etmez. Kullanım Koşulları bölümünde daha fazlasını okuyun.