
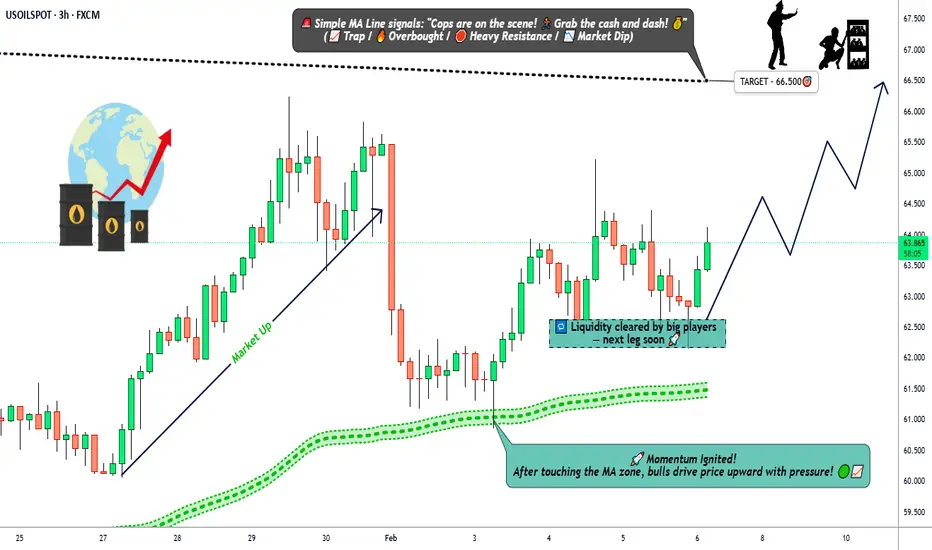
⚡ WTI CRUDE OIL (USOIL) - BULLISH SWING STRATEGY 🛢️
📊 Institutional Trading Plan | Global Energy Market
🎯 EXECUTIVE SUMMARY
Market: USOIL (WTI Crude Oil Spot)
Session: Day/Swing Trading
Direction: BULLISH (Confirmation)
Current Level: $63.65 USD/barrel
52-Week Range: $54.98 - $78.40
📈 TECHNICAL STRUCTURE OF THE PLAN
✅ Bullish Confirmation
WTI has formed a "Channel Up" monthly pattern, showing:
✨ Multiple Higher Highs and Higher Lows confirmed
✨ Positive response to key support levels (channel bottom)
✨ Technical pullback on Strategic Moving Averages
✨ Positive momentum with institutional volume
Recent: Crude oil bounced from $62.14 USD on February 2 session, validating key support after initial euphoria.
🔌 ENTRY STRATEGY - PROFESSIONAL LAYERING SYSTEM
Important Note: You are absolutely responsible for your trading decisions. This plan is educational, not financial recommendation.
📍 Entry Levels (Layering System - "Thief Strategy")
Layer 1 - Aggressive Entry:
$62.00 USD → Strong support + Technical confluence
Layer 2 - Strategic Entry:
$62.50 USD → 50-period Moving Average approximation
Layer 3 - Balanced Entry:
$63.00 USD → Neutral/pullback zone (current area)
Layer 4 - Conservative Entry:
$63.50 USD → Secondary impulse confirmation
Flexibility: Any entry level is viable according to your risk profile and preferred timeframe.
🎯 PRICE TARGET (TP) - INSTITUTIONAL RESISTANCE
Main Target: $66.50 USD/barrel
Technical Reasons:
✅ Historical structure resistance + expected pullback zone
✅ Overbought conditions detected on oscillators
✅ "Bullish trap" zone - institutional density
✅ Correlation with Brent ($68-70) suggests probable peak here
✅ Institutional profit-taking expected at this level
Secondary Scenario: If you break $66.50 with volume, next TP = $67.50-68.00 USD
🛑 STOP LOSS (SL) - RISK MANAGEMENT
Professional Stop Loss: $61.00 USD/barrel
Justification:
🛡️ Base support of monthly bullish channel
🛡️ Breaking below invalidates bullish thesis
🛡️ Optimal distance for favorable risk/reward ratio
🛡️ Technical level backed by multi-timeframe analysis
Your Responsibility: Setting SL is YOUR PERSONAL DECISION. Manage your capital according to risk tolerance.
💰 RELATED PAIRS TO MONITOR | CORRELATION ANALYSIS
🌍 Correlated Pairs:
1. BRENT CRUDE (EUCRUDE)
Current Price: $65.92 USD/barrel
Correlation: +0.92 (Highly correlated)
WTI/Brent Ratio: 1.04 (WTI slight discount)
Monitoring: If USOIL rises, EUCRUDE typically follows +1-2%
Key Point: Brent acts as "global barometer" of energy demand
2. US DOLLAR (DXY)
Correlation: -0.73 (Strong inverse)
Impact: Stronger USD = Cheaper oil (non-USD buyers lose purchasing power)
Critical Level: DXY > 107.50 generates downward pressure on USOIL
Strategy: Monitor Fed + interest rates
3. STOCK INDICES (S&P 500 / SPY)
Correlation: +0.68 (Risk-sentiment)
Dynamic: Bullish markets = Higher future energy demand
Bullish Divergence: If SPY rises but USOIL doesn't, speculative opportunity
4. RELATED ENERGY PAIRS
Gasoline (GASOLINE Futures): +0.85 correlation
Natural Gas (NGT): +0.45 correlation (weaker relationship)
Uranium (URA): +0.20 correlation (independent)
5. CHINESE YUAN PAIR (CNYRUB)
Correlation: +0.55 (Asian demand)
Context: China is world's largest crude importer
Indicator: Yuan weakness = Lower oil purchases
📰 CRITICAL FUNDAMENTAL & ECONOMIC FACTORS
🚨 GEOPOLITICS - RISK FACTOR #1
🔴 Current Situation (February 2026):
US-IRAN NEGOTIATIONS (Most Recent: February 6, 2026)
✅ Diplomatic conversations confirmed in Oman (February 6)
✅ Reduction of geopolitical risk premium since January highs
⚠️ Uncertainty: Disagreement on scope of negotiations persists
📊 Price Impact: Each "progress" news = -2 to -4% in WTI
📊 Price Impact: Collapse in negotiations = +3 to +8% in WTI
Critical Fact: Iran represents ~30% of OPEC production = Massive disruption potential
RUSSIA-UKRAINE TENSION
🔴 Recent attacks on Ukrainian energy infrastructure
⚖️ Possible high-level negotiations between Washington and Moscow
📍 Impact: Russian supplies (11% global) at potential risk
🎯 Monitoring: Any escalation = +$2-5 automatically in WTI
📊 SUPPLY AND DEMAND (Fundamentals)
OPEC+ DECISION (February 1, 2026)
✅ 8 OPEC+ countries reaffirm freeze on production increase for March
✅ DELAY OF INCREMENTS: Reason = weak seasonal demand (Q1)
📋 Reserve of cuts: 1.65 million barrels/day still available if market requires
🔄 Next Meeting: March 1, 2026 - Market Review
Excess Capacity:
🛢️ Spare capacity (~2.5 million bbl/day) mainly in Saudi Arabia
🛢️ Acts as "safety net" if Iran disconnects
💡 OPEC+ Strategy: Keep prices "comfortable" without deeper cuts
NORTH AMERICAN INVENTORIES (EIA - Last Week January 2026)
✅ DECLINE: -3.5 million barrels in week ending January 30
✅ Bullish signal = Reduction of surplus
📈 Critical next reports: every Thursday at 10:30 AM EST
GLOBAL PRODUCTION (Q3 2025 - Latest Data)
📊 OPEC Production: 106.03 million bbl/day
📊 Global Production (IEA): 108.06 million bbl/day
⚠️ 2026 Projection: Possible oversupply of 3.8 million bbl/day (per IEA)
⚠️ Long-term downward pressure
💱 GLOBAL ECONOMIC FACTORS
GLOBAL ENERGY DEMAND
🌐 Global economic growth 2026 = 3.1% (OPEC)
🌐 Energy demand growth 2026 = +1.4 million bbl/day (vs 2025)
🌐 OECD: +0.2 mb/d | Non-OECD: +1.2 mb/d
🎯 Impact: Lower growth = Limited upward pressure
KEY MACROECONOMIC INDICATORS
📉 Weak private employment data (USA) = Slowdown concerns
📉 Milder weather forecasts = Lower heating consumption
💪 ISM Manufacturing PMI (January USA): Next February 3 = Key for sentiment
DOLLAR STRENGTH
💹 DXY (Dollar Index) at relative highs
💹 Stronger dollar = More expensive oil in foreign currencies = Lower demand
💹 Change: Fed could hold rates or reduce based on February data
TRADE AGREEMENTS (Emerging Factor)
🤝 Trump-India: Oil tariff reduction (25% → 0%)
🤝 India can increase US crude purchases
📊 Impact: Potential demand +500k-1M bbl/day in US Oil
🎤 UPCOMING CRITICAL EVENTS TO MONITOR
📅 February 6 → US-Iran Negotiations in Oman 🔴 VERY HIGH IMPACT (Geopolitical Key)
📅 February 10 → ISM Services PMI (USA) 🟠 HIGH IMPACT (Economic Health)
📅 February 13 → Weekly EIA Inventories 🟡 MEDIUM-HIGH IMPACT (Real Demand)
📅 March 1 → OPEC+ Meeting Decision 🟠 HIGH IMPACT (Production Policy)
📅 February → Energy Corporate Earnings 🟡 MEDIUM IMPACT (Investment Guidance)
💎 "THIEF OG" TRADER WISHLIST - MOTIVATION & MINDSET
"In the energy market, patience is power. Institutions build positions slowly, while emotional traders lose fast."
🚀 Professional Trading Principles:
✨ "Lay Your Traps, Not Your Emotions"
Layered entries allow you to break even even on losing trades
Each dip is an opportunity to average down, not to panic
✨ "Follow the Institutions, Not the Hype"
Big funds wait at $62-63, they don't jump at $65
Institutional volumes confirm = USOIL will rise sustainably
✨ "Geopolitics is the New Fundamentals"
2026 is a year of uncertainty: Iran, Russia-Ukraine, China
Each news = Volatility = Opportunity for prepared traders
✨ "Risk Management is Not Boring, It's Freedom"
SL at $61.00 = Maximum -$2.65 loss per barrel
TP at $66.50 = Maximum +$3.85 gain per barrel
Ratio 1:1.45 = Professional, sustainable, repeatable
✨ "Trade the Plan, Not Your Dreams"
Layered entry = Don't perfect the timing (impossible)
Fixed TP = Take profits without regrets
Fixed SL = Controlled losses = Portfolio preserved
📈 CONCLUSION: WHY NOW IS THE TIME?
BULLISH SCENARIO: The confluence of technical factors + seasonality + controlled geopolitics = Clear swing trade opportunity
Ideal Setup:
✅ Confirmed monthly channel pattern bullish
✅ Technical pullback offers staggered entries
✅ Clear targets at institutional resistance
✅ Defined and rational stop loss
✅ Secondary correlations confirm energy panorama
Horizon: 5-15 days (Swing Trade) | Potential: +$2.85 - $3.85 per barrel
🛢️ "Oil doesn't lie. Fundamentals align with technicals. The question isn't 'if' USOIL rises to $66.50, but 'when'."
🎯 LET'S WIN, TRADER OG'S! RESPECT THE PLAN. 💪
📊 Institutional Trading Plan | Global Energy Market
🎯 EXECUTIVE SUMMARY
Market: USOIL (WTI Crude Oil Spot)
Session: Day/Swing Trading
Direction: BULLISH (Confirmation)
Current Level: $63.65 USD/barrel
52-Week Range: $54.98 - $78.40
📈 TECHNICAL STRUCTURE OF THE PLAN
✅ Bullish Confirmation
WTI has formed a "Channel Up" monthly pattern, showing:
✨ Multiple Higher Highs and Higher Lows confirmed
✨ Positive response to key support levels (channel bottom)
✨ Technical pullback on Strategic Moving Averages
✨ Positive momentum with institutional volume
Recent: Crude oil bounced from $62.14 USD on February 2 session, validating key support after initial euphoria.
🔌 ENTRY STRATEGY - PROFESSIONAL LAYERING SYSTEM
Important Note: You are absolutely responsible for your trading decisions. This plan is educational, not financial recommendation.
📍 Entry Levels (Layering System - "Thief Strategy")
Layer 1 - Aggressive Entry:
$62.00 USD → Strong support + Technical confluence
Layer 2 - Strategic Entry:
$62.50 USD → 50-period Moving Average approximation
Layer 3 - Balanced Entry:
$63.00 USD → Neutral/pullback zone (current area)
Layer 4 - Conservative Entry:
$63.50 USD → Secondary impulse confirmation
Flexibility: Any entry level is viable according to your risk profile and preferred timeframe.
🎯 PRICE TARGET (TP) - INSTITUTIONAL RESISTANCE
Main Target: $66.50 USD/barrel
Technical Reasons:
✅ Historical structure resistance + expected pullback zone
✅ Overbought conditions detected on oscillators
✅ "Bullish trap" zone - institutional density
✅ Correlation with Brent ($68-70) suggests probable peak here
✅ Institutional profit-taking expected at this level
Secondary Scenario: If you break $66.50 with volume, next TP = $67.50-68.00 USD
🛑 STOP LOSS (SL) - RISK MANAGEMENT
Professional Stop Loss: $61.00 USD/barrel
Justification:
🛡️ Base support of monthly bullish channel
🛡️ Breaking below invalidates bullish thesis
🛡️ Optimal distance for favorable risk/reward ratio
🛡️ Technical level backed by multi-timeframe analysis
Your Responsibility: Setting SL is YOUR PERSONAL DECISION. Manage your capital according to risk tolerance.
💰 RELATED PAIRS TO MONITOR | CORRELATION ANALYSIS
🌍 Correlated Pairs:
1. BRENT CRUDE (EUCRUDE)
Current Price: $65.92 USD/barrel
Correlation: +0.92 (Highly correlated)
WTI/Brent Ratio: 1.04 (WTI slight discount)
Monitoring: If USOIL rises, EUCRUDE typically follows +1-2%
Key Point: Brent acts as "global barometer" of energy demand
2. US DOLLAR (DXY)
Correlation: -0.73 (Strong inverse)
Impact: Stronger USD = Cheaper oil (non-USD buyers lose purchasing power)
Critical Level: DXY > 107.50 generates downward pressure on USOIL
Strategy: Monitor Fed + interest rates
3. STOCK INDICES (S&P 500 / SPY)
Correlation: +0.68 (Risk-sentiment)
Dynamic: Bullish markets = Higher future energy demand
Bullish Divergence: If SPY rises but USOIL doesn't, speculative opportunity
4. RELATED ENERGY PAIRS
Gasoline (GASOLINE Futures): +0.85 correlation
Natural Gas (NGT): +0.45 correlation (weaker relationship)
Uranium (URA): +0.20 correlation (independent)
5. CHINESE YUAN PAIR (CNYRUB)
Correlation: +0.55 (Asian demand)
Context: China is world's largest crude importer
Indicator: Yuan weakness = Lower oil purchases
📰 CRITICAL FUNDAMENTAL & ECONOMIC FACTORS
🚨 GEOPOLITICS - RISK FACTOR #1
🔴 Current Situation (February 2026):
US-IRAN NEGOTIATIONS (Most Recent: February 6, 2026)
✅ Diplomatic conversations confirmed in Oman (February 6)
✅ Reduction of geopolitical risk premium since January highs
⚠️ Uncertainty: Disagreement on scope of negotiations persists
📊 Price Impact: Each "progress" news = -2 to -4% in WTI
📊 Price Impact: Collapse in negotiations = +3 to +8% in WTI
Critical Fact: Iran represents ~30% of OPEC production = Massive disruption potential
RUSSIA-UKRAINE TENSION
🔴 Recent attacks on Ukrainian energy infrastructure
⚖️ Possible high-level negotiations between Washington and Moscow
📍 Impact: Russian supplies (11% global) at potential risk
🎯 Monitoring: Any escalation = +$2-5 automatically in WTI
📊 SUPPLY AND DEMAND (Fundamentals)
OPEC+ DECISION (February 1, 2026)
✅ 8 OPEC+ countries reaffirm freeze on production increase for March
✅ DELAY OF INCREMENTS: Reason = weak seasonal demand (Q1)
📋 Reserve of cuts: 1.65 million barrels/day still available if market requires
🔄 Next Meeting: March 1, 2026 - Market Review
Excess Capacity:
🛢️ Spare capacity (~2.5 million bbl/day) mainly in Saudi Arabia
🛢️ Acts as "safety net" if Iran disconnects
💡 OPEC+ Strategy: Keep prices "comfortable" without deeper cuts
NORTH AMERICAN INVENTORIES (EIA - Last Week January 2026)
✅ DECLINE: -3.5 million barrels in week ending January 30
✅ Bullish signal = Reduction of surplus
📈 Critical next reports: every Thursday at 10:30 AM EST
GLOBAL PRODUCTION (Q3 2025 - Latest Data)
📊 OPEC Production: 106.03 million bbl/day
📊 Global Production (IEA): 108.06 million bbl/day
⚠️ 2026 Projection: Possible oversupply of 3.8 million bbl/day (per IEA)
⚠️ Long-term downward pressure
💱 GLOBAL ECONOMIC FACTORS
GLOBAL ENERGY DEMAND
🌐 Global economic growth 2026 = 3.1% (OPEC)
🌐 Energy demand growth 2026 = +1.4 million bbl/day (vs 2025)
🌐 OECD: +0.2 mb/d | Non-OECD: +1.2 mb/d
🎯 Impact: Lower growth = Limited upward pressure
KEY MACROECONOMIC INDICATORS
📉 Weak private employment data (USA) = Slowdown concerns
📉 Milder weather forecasts = Lower heating consumption
💪 ISM Manufacturing PMI (January USA): Next February 3 = Key for sentiment
DOLLAR STRENGTH
💹 DXY (Dollar Index) at relative highs
💹 Stronger dollar = More expensive oil in foreign currencies = Lower demand
💹 Change: Fed could hold rates or reduce based on February data
TRADE AGREEMENTS (Emerging Factor)
🤝 Trump-India: Oil tariff reduction (25% → 0%)
🤝 India can increase US crude purchases
📊 Impact: Potential demand +500k-1M bbl/day in US Oil
🎤 UPCOMING CRITICAL EVENTS TO MONITOR
📅 February 6 → US-Iran Negotiations in Oman 🔴 VERY HIGH IMPACT (Geopolitical Key)
📅 February 10 → ISM Services PMI (USA) 🟠 HIGH IMPACT (Economic Health)
📅 February 13 → Weekly EIA Inventories 🟡 MEDIUM-HIGH IMPACT (Real Demand)
📅 March 1 → OPEC+ Meeting Decision 🟠 HIGH IMPACT (Production Policy)
📅 February → Energy Corporate Earnings 🟡 MEDIUM IMPACT (Investment Guidance)
💎 "THIEF OG" TRADER WISHLIST - MOTIVATION & MINDSET
"In the energy market, patience is power. Institutions build positions slowly, while emotional traders lose fast."
🚀 Professional Trading Principles:
✨ "Lay Your Traps, Not Your Emotions"
Layered entries allow you to break even even on losing trades
Each dip is an opportunity to average down, not to panic
✨ "Follow the Institutions, Not the Hype"
Big funds wait at $62-63, they don't jump at $65
Institutional volumes confirm = USOIL will rise sustainably
✨ "Geopolitics is the New Fundamentals"
2026 is a year of uncertainty: Iran, Russia-Ukraine, China
Each news = Volatility = Opportunity for prepared traders
✨ "Risk Management is Not Boring, It's Freedom"
SL at $61.00 = Maximum -$2.65 loss per barrel
TP at $66.50 = Maximum +$3.85 gain per barrel
Ratio 1:1.45 = Professional, sustainable, repeatable
✨ "Trade the Plan, Not Your Dreams"
Layered entry = Don't perfect the timing (impossible)
Fixed TP = Take profits without regrets
Fixed SL = Controlled losses = Portfolio preserved
📈 CONCLUSION: WHY NOW IS THE TIME?
BULLISH SCENARIO: The confluence of technical factors + seasonality + controlled geopolitics = Clear swing trade opportunity
Ideal Setup:
✅ Confirmed monthly channel pattern bullish
✅ Technical pullback offers staggered entries
✅ Clear targets at institutional resistance
✅ Defined and rational stop loss
✅ Secondary correlations confirm energy panorama
Horizon: 5-15 days (Swing Trade) | Potential: +$2.85 - $3.85 per barrel
🛢️ "Oil doesn't lie. Fundamentals align with technicals. The question isn't 'if' USOIL rises to $66.50, but 'when'."
🎯 LET'S WIN, TRADER OG'S! RESPECT THE PLAN. 💪

Feragatname
Bilgiler ve yayınlar, TradingView tarafından sağlanan veya onaylanan finansal, yatırım, alım satım veya diğer türden tavsiye veya öneriler anlamına gelmez ve teşkil etmez. Kullanım Koşulları bölümünde daha fazlasını okuyun.
Feragatname
Bilgiler ve yayınlar, TradingView tarafından sağlanan veya onaylanan finansal, yatırım, alım satım veya diğer türden tavsiye veya öneriler anlamına gelmez ve teşkil etmez. Kullanım Koşulları bölümünde daha fazlasını okuyun.