
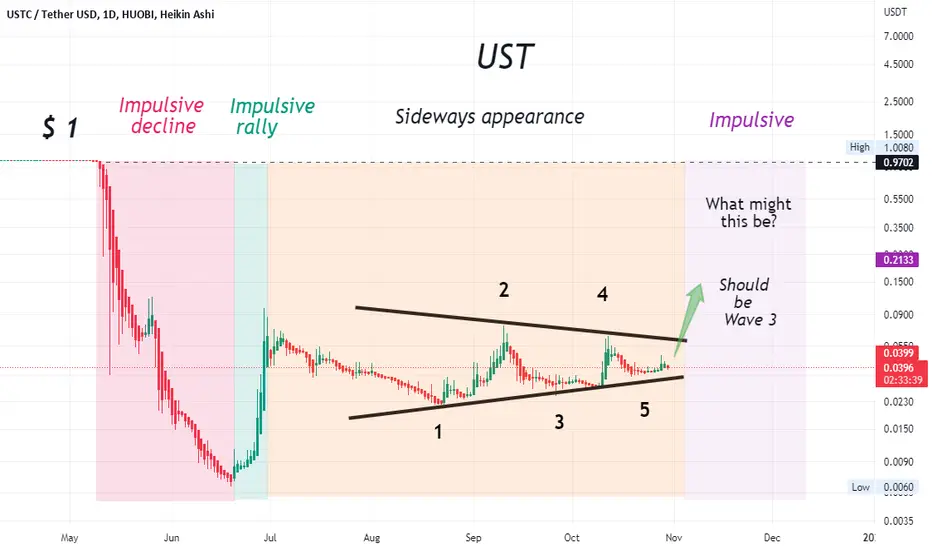
As shown on this chart (consists of three distinct sections),
1-Impulsive decline = supply > demand,
2-Impulsive rally = demand > supply,
3- Sideways appearance = supply and demand are nearly equal.
What to expect next?
At this point, low volatility and low volume indicate a drying up of selling pressure.
Target
Point and Figure Configuration:

1-Impulsive decline = supply > demand,
2-Impulsive rally = demand > supply,
3- Sideways appearance = supply and demand are nearly equal.
What to expect next?
At this point, low volatility and low volume indicate a drying up of selling pressure.
Target
Point and Figure Configuration:
Not
Not
Not
Not
Not
Not
Not

Feragatname
Bilgiler ve yayınlar, TradingView tarafından sağlanan veya onaylanan finansal, yatırım, alım satım veya diğer türden tavsiye veya öneriler anlamına gelmez ve teşkil etmez. Kullanım Koşulları bölümünde daha fazlasını okuyun.
Feragatname
Bilgiler ve yayınlar, TradingView tarafından sağlanan veya onaylanan finansal, yatırım, alım satım veya diğer türden tavsiye veya öneriler anlamına gelmez ve teşkil etmez. Kullanım Koşulları bölümünde daha fazlasını okuyun.