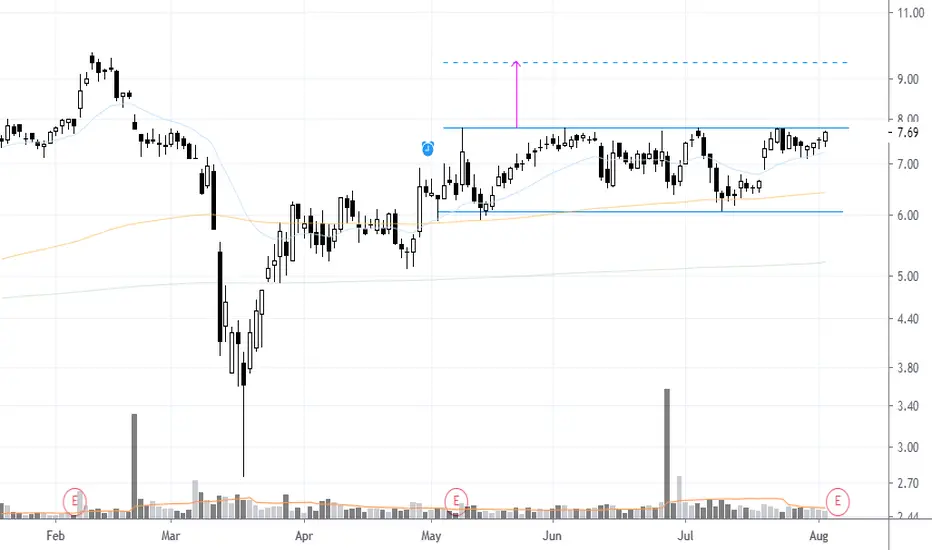
 UTI has been moving sideways for 3 months forming a well defined rectangle chart pattern. The stock has tested the $7.75 price level 5 times in the last few weeks. A break and daily close above that level sets the stock for a run to its chart pattern price target around $9.50, a 21% price increase from breakout level. Earnings coming up in 2 days. Add this stock to your watch list and look for long entry on breakout post earnings.

✔ Momentum & Breakout Trader Since 2006 | Influenced by Mark Minervini VCP Trading Style & William O'Neil CANSLIM 📈
✔ Follow me on Twitter @taplot - twitter.com/TaPlot
✔ YouTube channel youtube.com/@taplot
✔ Follow me on Twitter @taplot - twitter.com/TaPlot
✔ YouTube channel youtube.com/@taplot
Feragatname
Bilgiler ve yayınlar, TradingView tarafından sağlanan veya onaylanan finansal, yatırım, alım satım veya diğer türden tavsiye veya öneriler anlamına gelmez ve teşkil etmez. Kullanım Koşulları bölümünde daha fazlasını okuyun.