
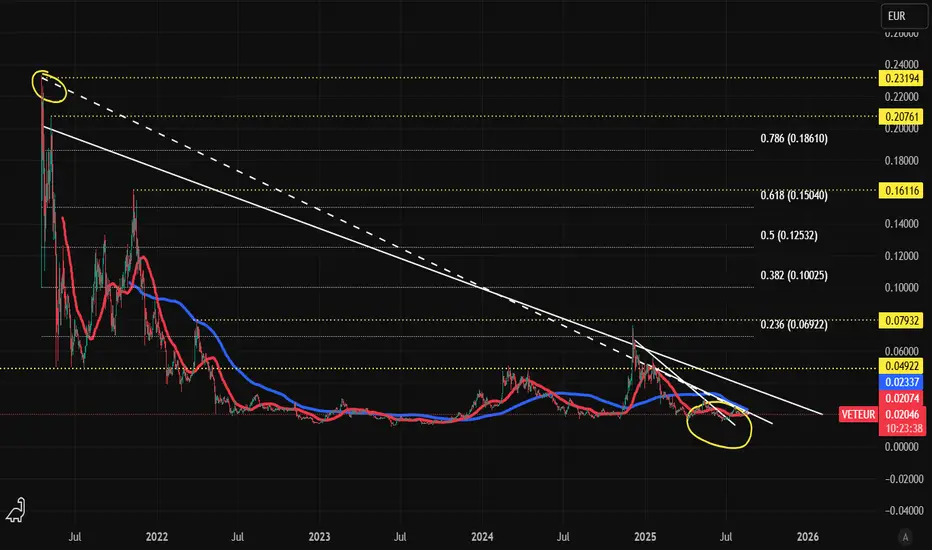
Can anyone help me with charting VET. I am trading at the Daily. Daily stock heading to the bottom. Still in A phase. 50/200MA cross about to come. I want to sort out my TP. The yellow dotted lines are resistances. I took a Fib from ATH at dec 2021 to the bottom (yellow circles). Did I draw the Fib right? I am planning my trade ahead. Already inn for a good price. I think my next TP on the Daily will be between 0.048 (last high) and 0.069 (Fib 0.236) or can I look at the next Fib 0.382 because the 0.236 was already hit in dec 2024? another question, did I draw the trendlines correct?

Feragatname
Bilgiler ve yayınlar, TradingView tarafından sağlanan veya onaylanan finansal, yatırım, alım satım veya diğer türden tavsiye veya öneriler anlamına gelmez ve teşkil etmez. Kullanım Koşulları bölümünde daha fazlasını okuyun.
Feragatname
Bilgiler ve yayınlar, TradingView tarafından sağlanan veya onaylanan finansal, yatırım, alım satım veya diğer türden tavsiye veya öneriler anlamına gelmez ve teşkil etmez. Kullanım Koşulları bölümünde daha fazlasını okuyun.