
The  VET weekly chart is looking bullish AF.
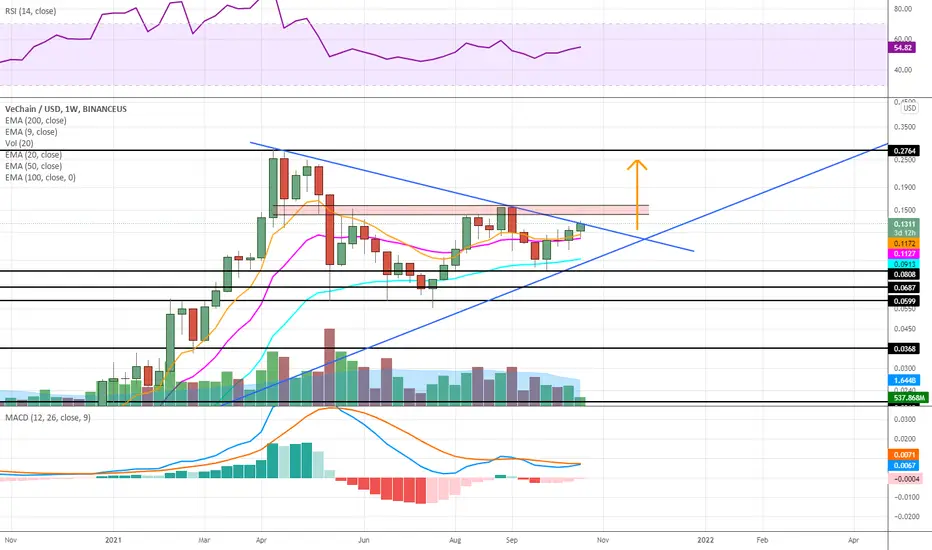
Held the 9EMA and 20EMA on the weekly timeframe and is pushing up again the blue downtrend line. Still see some resistance in the 0.15-0.16 area but if it can break it then we should see previous highs around 0.25-0.28.
VET weekly chart is looking bullish AF.Held the 9EMA and 20EMA on the weekly timeframe and is pushing up again the blue downtrend line. Still see some resistance in the 0.15-0.16 area but if it can break it then we should see previous highs around 0.25-0.28.

Feragatname
Bilgiler ve yayınlar, TradingView tarafından sağlanan veya onaylanan finansal, yatırım, alım satım veya diğer türden tavsiye veya öneriler anlamına gelmez ve teşkil etmez. Kullanım Koşulları bölümünde daha fazlasını okuyun.
Feragatname
Bilgiler ve yayınlar, TradingView tarafından sağlanan veya onaylanan finansal, yatırım, alım satım veya diğer türden tavsiye veya öneriler anlamına gelmez ve teşkil etmez. Kullanım Koşulları bölümünde daha fazlasını okuyun.