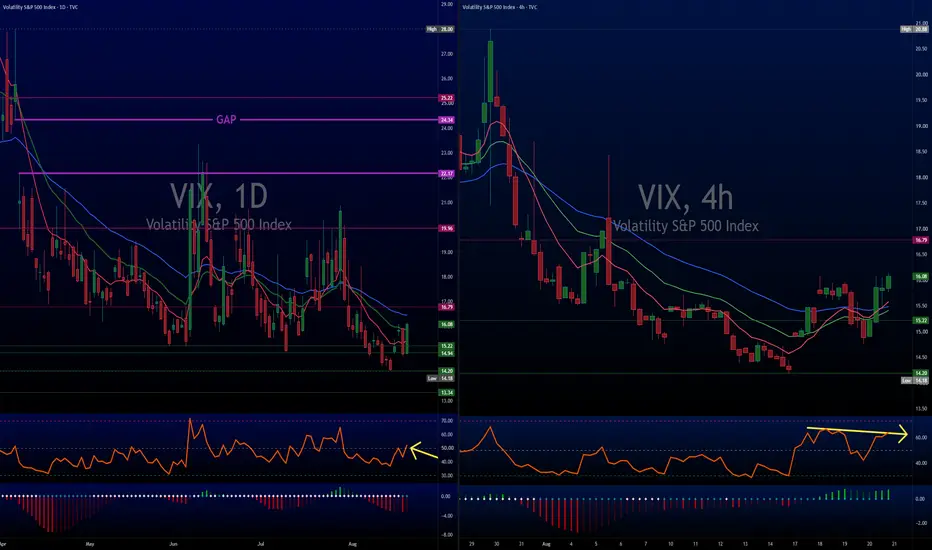
Market volatility has spent weeks grinding lower, but the charts are signaling that a shift could be right around the corner.
What the Charts Are Showing:
Strong Floor Defended: Volatility swept down to multi month lows and bounced back. Buyers stepped in to defend the baseline === downside protection and option demand picked up.
Energy is Building (Daily): The downward selling pressure has steadily dried up on the daily timeframe. When momentum compresses like this after testing major support, it often acts like a coiled spring.
Short Term Resistance Test (4Hr): The move is taking a quick breather near short term moving averages. A clean break over 16.00 opens up room for momentum to accelerate. (started to move higher as we wrote this, so gaining some steam)
Takeaway:
While the short term chart is catching its breath at resistance, the bigger daily picture shows volatility setting a higher low and coiling up. Keep an eye on broad market risk if
 VIX strongly clears 16.00.
Not financial advice. Manage risk accordingly.
TGtg!
VIX School:The Underlying Engine (SPX Put Demand): VIX is calculated from
 SPX option prices. When institutions rush to buy out of the money SPX put options for downside protection, implied volatility expands, which mathematically pushes the VIX upward.
Derivative Flow (VIX Futures & Calls): Traders and hedgers buy VIX front month futures or VIX call options when they anticipate a market pullback, which bids up volatility pricing across the curve.

İlgili yayınlar
Feragatname
Bilgiler ve yayınlar, TradingView tarafından sağlanan veya onaylanan finansal, yatırım, alım satım veya diğer türden tavsiye veya öneriler anlamına gelmez ve teşkil etmez. Kullanım Koşulları bölümünde daha fazlasını okuyun.
Feragatname
Bilgiler ve yayınlar, TradingView tarafından sağlanan veya onaylanan finansal, yatırım, alım satım veya diğer türden tavsiye veya öneriler anlamına gelmez ve teşkil etmez. Kullanım Koşulları bölümünde daha fazlasını okuyun.