This is not a chart analysis piece. It is context that every market participant should understand before making decisions about how their capital is allocated.
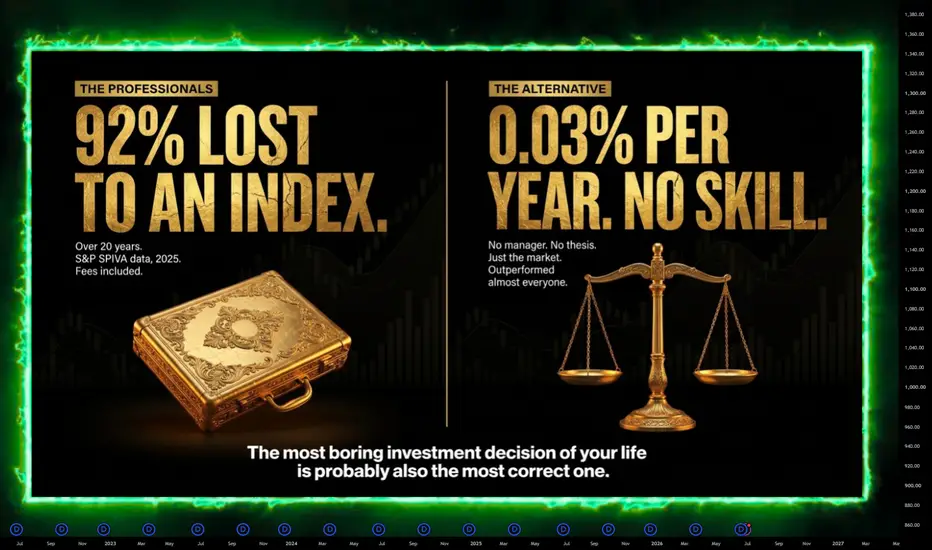
S&P Dow Jones Indices' SPIVA Scorecard, which has tracked active fund manager performance against benchmark indices for 25 years, released its year-end 2025 data last month. 79% of all actively managed large-cap US equity funds underperformed the S&P 500 in 2025. Over 20 years, the figure is approximately 92%. Over 15 years, zero out of 22 US equity categories had a majority of active managers outperforming.
What this means for traders and investors using TradingView
The platforms and tools available to retail investors today, real-time charting, technical analysis, moving average systems, volume analysis, momentum indicators, represent something the data above does not capture. The SPIVA data tracks passive stock-picking mutual fund managers, not systematic technical traders using defined rule-based entry and exit frameworks.

A systematic trader who uses the 200-week and 50-week EMA structure to identify structural entry points in quality assets, applies a defined stop-loss methodology, and scales out at verified Fibonacci extension targets, is doing something structurally different from an active fund manager trying to pick stocks based on fundamental research and market calls.
The data on active fund manager underperformance does not invalidate systematic technical trading methodology. It invalidates the specific practice of paying a professional to pick stocks on your behalf in the hope of beating an index, which is a different activity entirely.
The relevant implication for portfolio construction
A low-cost index fund tracking the S&P 500 such as VOO at 0.03% annual expense has outperformed 92% of actively managed alternatives over 20 years. That makes it a rational core holding for the long-term portion of any portfolio.
Systematic technical strategies applied to timing and entry around structural levels such as the 200-week EMA are additive to that core, not a replacement for it. The two approaches are not in competition. They serve different functions in a well-constructed portfolio.
Understand the data. Use it to make better decisions about how you allocate capital. That is the only reason to publish it here.
Not financial advice. All commentary is for educational purposes only.
S&P Dow Jones Indices' SPIVA Scorecard, which has tracked active fund manager performance against benchmark indices for 25 years, released its year-end 2025 data last month. 79% of all actively managed large-cap US equity funds underperformed the S&P 500 in 2025. Over 20 years, the figure is approximately 92%. Over 15 years, zero out of 22 US equity categories had a majority of active managers outperforming.
What this means for traders and investors using TradingView
The platforms and tools available to retail investors today, real-time charting, technical analysis, moving average systems, volume analysis, momentum indicators, represent something the data above does not capture. The SPIVA data tracks passive stock-picking mutual fund managers, not systematic technical traders using defined rule-based entry and exit frameworks.
A systematic trader who uses the 200-week and 50-week EMA structure to identify structural entry points in quality assets, applies a defined stop-loss methodology, and scales out at verified Fibonacci extension targets, is doing something structurally different from an active fund manager trying to pick stocks based on fundamental research and market calls.
The data on active fund manager underperformance does not invalidate systematic technical trading methodology. It invalidates the specific practice of paying a professional to pick stocks on your behalf in the hope of beating an index, which is a different activity entirely.
The relevant implication for portfolio construction
A low-cost index fund tracking the S&P 500 such as
VOO at 0.03% annual expense has outperformed 92% of actively managed alternatives over 20 years. That makes it a rational core holding for the long-term portion of any portfolio.Systematic technical strategies applied to timing and entry around structural levels such as the 200-week EMA are additive to that core, not a replacement for it. The two approaches are not in competition. They serve different functions in a well-constructed portfolio.
Understand the data. Use it to make better decisions about how you allocate capital. That is the only reason to publish it here.
Not financial advice. All commentary is for educational purposes only.

⭐ Follow the 3-Gate System - tradedesk.rbtrading.site
⭐ Prop Firm Deals - linktr.ee/rb_tradingltd
⭐ #1 Free Trading Journal Lite | +20% Off Pro code RBT20 - rbtrading.site/?ref=RBT20
⭐ Prop Firm Deals - linktr.ee/rb_tradingltd
⭐ #1 Free Trading Journal Lite | +20% Off Pro code RBT20 - rbtrading.site/?ref=RBT20
Feragatname
Bilgiler ve yayınlar, TradingView tarafından sağlanan veya onaylanan finansal, yatırım, alım satım veya diğer türden tavsiye veya öneriler anlamına gelmez ve teşkil etmez. Kullanım Koşulları bölümünde daha fazlasını okuyun.
⭐ Follow the 3-Gate System - tradedesk.rbtrading.site
⭐ Prop Firm Deals - linktr.ee/rb_tradingltd
⭐ #1 Free Trading Journal Lite | +20% Off Pro code RBT20 - rbtrading.site/?ref=RBT20
⭐ Prop Firm Deals - linktr.ee/rb_tradingltd
⭐ #1 Free Trading Journal Lite | +20% Off Pro code RBT20 - rbtrading.site/?ref=RBT20
Feragatname
Bilgiler ve yayınlar, TradingView tarafından sağlanan veya onaylanan finansal, yatırım, alım satım veya diğer türden tavsiye veya öneriler anlamına gelmez ve teşkil etmez. Kullanım Koşulları bölümünde daha fazlasını okuyun.