
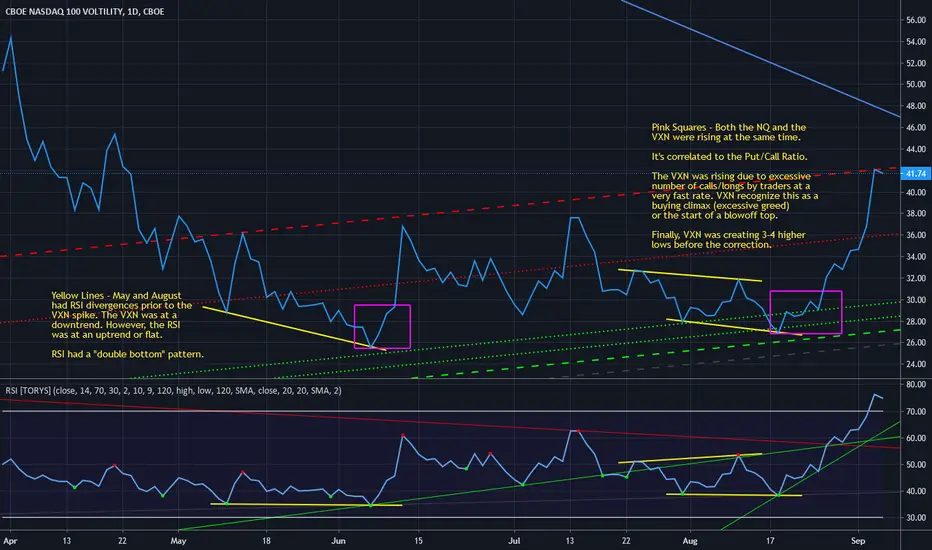
VXN at the daily view.
This is a project that my trading team and I are conducting. This is 3 of 9 charts (available on Trading View) that searches for clues for an imminent correction by using both June and September 2020 cases. It's a comprehensive overview that connects the charts volatility, trends, divergences, credit, and currency strength.
In this chart, the VXN had RSI divergences prior to the corrections. In addition, the VXN created 3-4 higher lows in a row prior to a correction.
This is a project that my trading team and I are conducting. This is 3 of 9 charts (available on Trading View) that searches for clues for an imminent correction by using both June and September 2020 cases. It's a comprehensive overview that connects the charts volatility, trends, divergences, credit, and currency strength.
In this chart, the VXN had RSI divergences prior to the corrections. In addition, the VXN created 3-4 higher lows in a row prior to a correction.

Feragatname
Bilgiler ve yayınlar, TradingView tarafından sağlanan veya onaylanan finansal, yatırım, alım satım veya diğer türden tavsiye veya öneriler anlamına gelmez ve teşkil etmez. Kullanım Koşulları bölümünde daha fazlasını okuyun.
Feragatname
Bilgiler ve yayınlar, TradingView tarafından sağlanan veya onaylanan finansal, yatırım, alım satım veya diğer türden tavsiye veya öneriler anlamına gelmez ve teşkil etmez. Kullanım Koşulları bölümünde daha fazlasını okuyun.