Alış
Walmart by the Hour
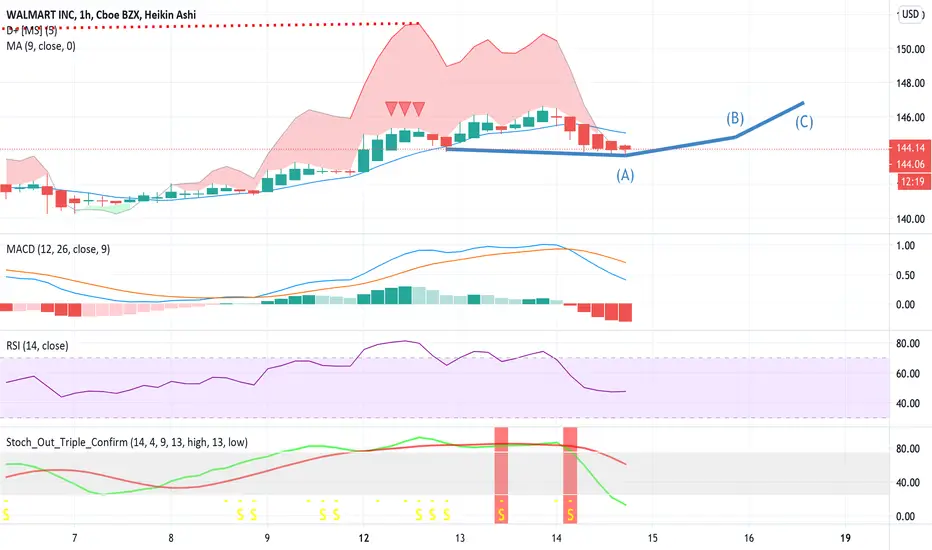
With the small candle at point A we can see that the bearish selling has been getting weaker. The MACD shows strong bear strength but could quickly weaken. As they are loosing buying strength. How do I know they are loosing strength? Take a look at the RSI. WMT returned to its normal range of 48 for its RSI and does not historically stay that low very long. Follow to see how my trend line turns out, give a like if you are a Walmart Bull, and finally comment your thoughts if you agree or disagree. Would love to hear your thoughts. Thank you!
Not
Just checking back in on some of my Charts and from point (A) to point (B) I nailed it! Lets see point (B) to (C)
İlgili yayınlar
Feragatname
Bilgiler ve yayınlar, TradingView tarafından sağlanan veya onaylanan finansal, yatırım, alım satım veya diğer türden tavsiye veya öneriler anlamına gelmez ve teşkil etmez. Kullanım Koşulları bölümünde daha fazlasını okuyun.
İlgili yayınlar
Feragatname
Bilgiler ve yayınlar, TradingView tarafından sağlanan veya onaylanan finansal, yatırım, alım satım veya diğer türden tavsiye veya öneriler anlamına gelmez ve teşkil etmez. Kullanım Koşulları bölümünde daha fazlasını okuyun.