
📊 Silver (XAG/USD) 4H Technical Outlook — Controlled Pullback Within Prior Uptrend ⚖️
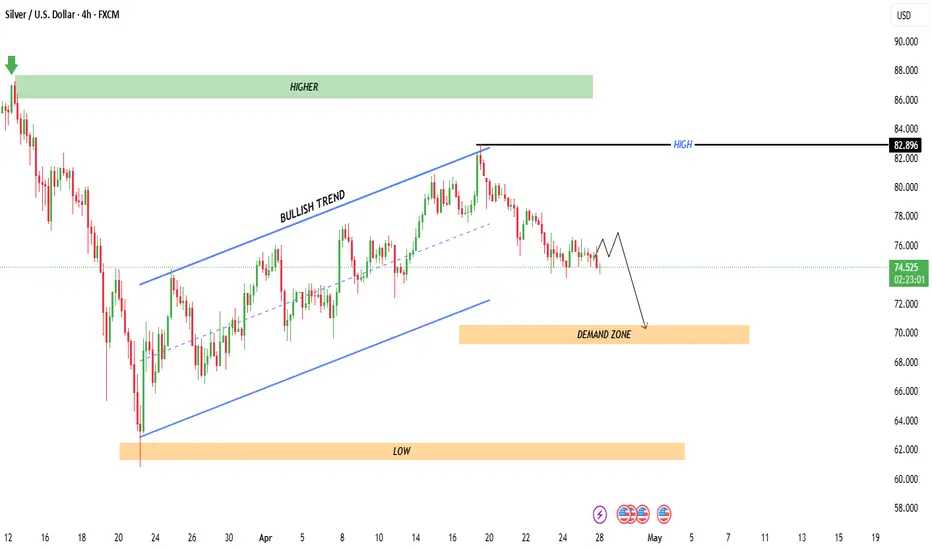
The chart shows Silver / U.S. Dollar (XAG/USD) on the 4-hour timeframe, where price action has recently transitioned from a structured bullish channel into a corrective phase.
🧭 Trend Structure & Context
Price previously respected a bullish ascending channel (clearly defined higher highs and higher lows).
The breakout attempt near the 82.8 resistance (labeled HIGH) failed to sustain momentum.
Since then, structure has shifted into a short-term bearish correction, with lower highs forming.
👉 This suggests loss of bullish momentum, not necessarily a full trend reversal yet.
🔑 Key Levels to Watch
Resistance (Supply): ~82.8
→ Strong rejection zone; buyers failed to maintain control here.
Current Price Area: ~74.5
→ Mid-range consolidation with weak bullish follow-through.
Demand Zone: 69.5 – 71.0
→ Highlighted zone where buyers are expected to step back in.
Major Low Support: ~62
→ Macro support; invalidation zone for broader bullish structure.
📉 Price Behavior & Projection
The chart shows a bearish continuation path (arrow):
Minor consolidation / weak bounce
Followed by a move into the demand zone
📌 This aligns with:
Breakdown from the channel
Failure to create new highs
Gradual formation of lower highs
⚙️ Market Interpretation
The prior bullish trend is weakening, transitioning into a corrective phase.
Sellers currently have short-term control.
However, the broader structure still allows for a bullish reaction at demand.
🧠 Trading Scenarios
🔻 Bearish Scenario (Higher Probability Short-Term)
Rejection below ~76–78 zone
Continuation toward 70 demand area
Momentum likely increases on breakdown
🔄 Bullish Scenario (Conditional)
Strong bounce from demand zone (69–71)
Reclaim of broken trend structure
Target retest of 80–82 highs
⚠️ Risk Factors
Sudden volatility spikes (common in metals)
False breakdowns near demand
Macro catalysts impacting precious metals market
🧾 Summary
📉 Short-term bias: Bearish / corrective
📊 Mid-term outlook: Neutral-to-bullish if demand holds
🎯 Key play: Watch for reaction at 69–71 demand zone
The chart shows Silver / U.S. Dollar (XAG/USD) on the 4-hour timeframe, where price action has recently transitioned from a structured bullish channel into a corrective phase.
🧭 Trend Structure & Context
Price previously respected a bullish ascending channel (clearly defined higher highs and higher lows).
The breakout attempt near the 82.8 resistance (labeled HIGH) failed to sustain momentum.
Since then, structure has shifted into a short-term bearish correction, with lower highs forming.
👉 This suggests loss of bullish momentum, not necessarily a full trend reversal yet.
🔑 Key Levels to Watch
Resistance (Supply): ~82.8
→ Strong rejection zone; buyers failed to maintain control here.
Current Price Area: ~74.5
→ Mid-range consolidation with weak bullish follow-through.
Demand Zone: 69.5 – 71.0
→ Highlighted zone where buyers are expected to step back in.
Major Low Support: ~62
→ Macro support; invalidation zone for broader bullish structure.
📉 Price Behavior & Projection
The chart shows a bearish continuation path (arrow):
Minor consolidation / weak bounce
Followed by a move into the demand zone
📌 This aligns with:
Breakdown from the channel
Failure to create new highs
Gradual formation of lower highs
⚙️ Market Interpretation
The prior bullish trend is weakening, transitioning into a corrective phase.
Sellers currently have short-term control.
However, the broader structure still allows for a bullish reaction at demand.
🧠 Trading Scenarios
🔻 Bearish Scenario (Higher Probability Short-Term)
Rejection below ~76–78 zone
Continuation toward 70 demand area
Momentum likely increases on breakdown
🔄 Bullish Scenario (Conditional)
Strong bounce from demand zone (69–71)
Reclaim of broken trend structure
Target retest of 80–82 highs
⚠️ Risk Factors
Sudden volatility spikes (common in metals)
False breakdowns near demand
Macro catalysts impacting precious metals market
🧾 Summary
📉 Short-term bias: Bearish / corrective
📊 Mid-term outlook: Neutral-to-bullish if demand holds
🎯 Key play: Watch for reaction at 69–71 demand zone
İşlem aktif
XAGUSD Update – Clean Move to Target 🎯🔥
✅ Price respected the bullish structure earlier and tapped the high zone perfectly
📉 Now showing rejection from resistance → shift in momentum
🔄 Market is following the planned bearish path
🎯 Current View
Small pullback ➡️ continuation down
Target: Demand zone (~70 area)
🧠 Summary
Your analysis is playing out well ✔️
Market is moving exactly as expected — stay patient & let it hit TP 🧘♂️📉

✦ MARKET STRATEGY SIGNALS ✦ 📊
Smart Money • Price Action • Precision • good entries
📲 Join Telegram: t.me/marketstrategyentry
Smart Money • Price Action • Precision • good entries
📲 Join Telegram: t.me/marketstrategyentry
İlgili yayınlar
Feragatname
Bilgiler ve yayınlar, TradingView tarafından sağlanan veya onaylanan finansal, yatırım, alım satım veya diğer türden tavsiye veya öneriler anlamına gelmez ve teşkil etmez. Kullanım Koşulları bölümünde daha fazlasını okuyun.
✦ MARKET STRATEGY SIGNALS ✦ 📊
Smart Money • Price Action • Precision • good entries
📲 Join Telegram: t.me/marketstrategyentry
Smart Money • Price Action • Precision • good entries
📲 Join Telegram: t.me/marketstrategyentry
İlgili yayınlar
Feragatname
Bilgiler ve yayınlar, TradingView tarafından sağlanan veya onaylanan finansal, yatırım, alım satım veya diğer türden tavsiye veya öneriler anlamına gelmez ve teşkil etmez. Kullanım Koşulları bölümünde daha fazlasını okuyun.