
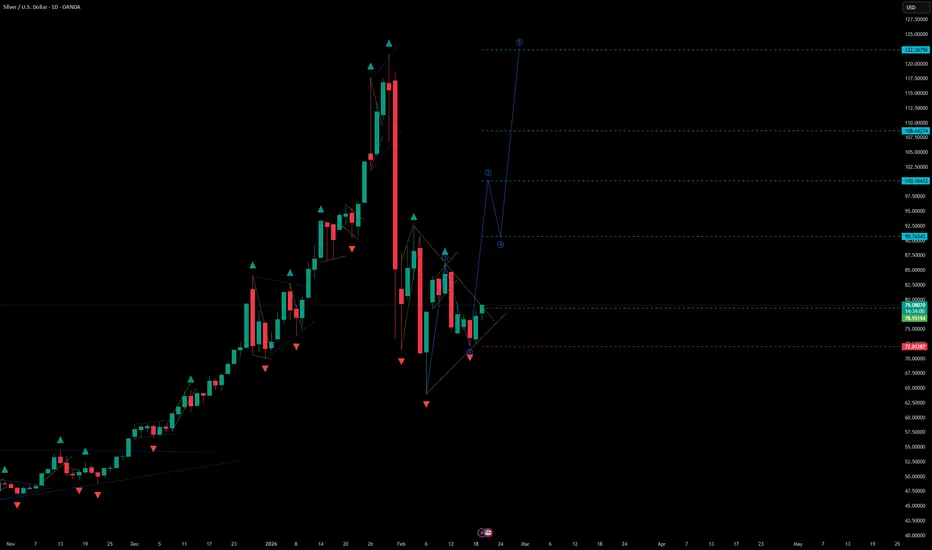
Silver (XAGUSD) — D1 Formation of a Potential Wave 3 + Trendline Break (Bullish Continuation)
🔎 Market Structure (D1)
On the daily timeframe, Silver is forming the technical conditions for the development of Wave 3 to the upside, confirmed by:
a breakout above the corrective trendline (trendline break)
completion of the corrective phase (Wave 2) with a compression structure
rebound from a local support zone after the pullback
recovery of bullish structure after the impulse base was formed
The current price action fits a classic Elliott Wave continuation model, where Wave 3 starts after price exits the corrective structure and resumes the dominant trend.
📐 Elliott Wave Context
Wave 1: initial impulsive move up
Wave 2: corrective pullback / consolidation within structure
Wave 3: expected impulsive expansion higher (current scenario)
📌 Key principle:
The bullish scenario remains valid as long as price holds above the invalidation level (below).
📍 Entry
Entry: 78.55194
The entry is positioned:
after the trendline breakout (structure shift confirmation)
in the impulse activation zone following Wave 2 completion
aligned with continuation momentum rather than chasing the top
🎯 Target Levels (Wave 3 Projections)
Targets are derived from projected impulse expansion zones and key reaction levels:
TP1: 90.74343
TP2: 100.16412
TP3: 108.64274
TP4: 122.36796
Each target acts as a potential reaction area and a logical level for partial profit-taking as Wave 3 progresses.
🛑 Invalidation / Stop Loss
Stop Loss: 72.01287
📍 The stop is placed below the key structural low (base of the prior leg), which:
invalidates the Wave 3 bullish continuation if breached
signals a deeper corrective structure or trend failure
follows Elliott Wave risk management by protecting against a full structure shift
🧠 Risk & Trade Management
Trend-following setup
Wave 3 is typically the strongest wave, but volatility can increase.
Recommended approach:
partial profits at TP1 / TP2
move stop to breakeven after a clean impulsive continuation is confirmed
consider scaling only on pullbacks (intrawave retracements) within Wave 3
if price falls back under the broken trendline and holds, reassess the bullish scenario
📌 Summary
XAGUSD on D1 shows a corrective trendline breakout and signs of Wave 2 completion, supporting a potential Wave 3 continuation to the upside.
The bullish scenario remains valid above 72.01287, with upside targets at 90.74343 → 100.16412 → 108.64274 → 122.36796.
🔎 Market Structure (D1)
On the daily timeframe, Silver is forming the technical conditions for the development of Wave 3 to the upside, confirmed by:
a breakout above the corrective trendline (trendline break)
completion of the corrective phase (Wave 2) with a compression structure
rebound from a local support zone after the pullback
recovery of bullish structure after the impulse base was formed
The current price action fits a classic Elliott Wave continuation model, where Wave 3 starts after price exits the corrective structure and resumes the dominant trend.
📐 Elliott Wave Context
Wave 1: initial impulsive move up
Wave 2: corrective pullback / consolidation within structure
Wave 3: expected impulsive expansion higher (current scenario)
📌 Key principle:
The bullish scenario remains valid as long as price holds above the invalidation level (below).
📍 Entry
Entry: 78.55194
The entry is positioned:
after the trendline breakout (structure shift confirmation)
in the impulse activation zone following Wave 2 completion
aligned with continuation momentum rather than chasing the top
🎯 Target Levels (Wave 3 Projections)
Targets are derived from projected impulse expansion zones and key reaction levels:
TP1: 90.74343
TP2: 100.16412
TP3: 108.64274
TP4: 122.36796
Each target acts as a potential reaction area and a logical level for partial profit-taking as Wave 3 progresses.
🛑 Invalidation / Stop Loss
Stop Loss: 72.01287
📍 The stop is placed below the key structural low (base of the prior leg), which:
invalidates the Wave 3 bullish continuation if breached
signals a deeper corrective structure or trend failure
follows Elliott Wave risk management by protecting against a full structure shift
🧠 Risk & Trade Management
Trend-following setup
Wave 3 is typically the strongest wave, but volatility can increase.
Recommended approach:
partial profits at TP1 / TP2
move stop to breakeven after a clean impulsive continuation is confirmed
consider scaling only on pullbacks (intrawave retracements) within Wave 3
if price falls back under the broken trendline and holds, reassess the bullish scenario
📌 Summary
XAGUSD on D1 shows a corrective trendline breakout and signs of Wave 2 completion, supporting a potential Wave 3 continuation to the upside.
The bullish scenario remains valid above 72.01287, with upside targets at 90.74343 → 100.16412 → 108.64274 → 122.36796.

Feragatname
Bilgiler ve yayınlar, TradingView tarafından sağlanan veya onaylanan finansal, yatırım, alım satım veya diğer türden tavsiye veya öneriler anlamına gelmez ve teşkil etmez. Kullanım Koşulları bölümünde daha fazlasını okuyun.
Feragatname
Bilgiler ve yayınlar, TradingView tarafından sağlanan veya onaylanan finansal, yatırım, alım satım veya diğer türden tavsiye veya öneriler anlamına gelmez ve teşkil etmez. Kullanım Koşulları bölümünde daha fazlasını okuyun.