
XAUUSD Approaches Year Open Support After Major Bearish Breakdow
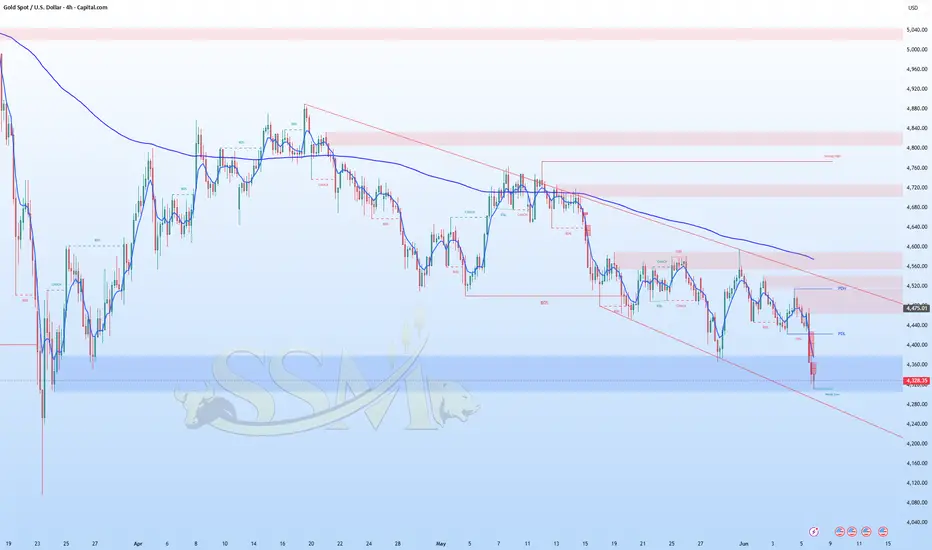
The chart remains strongly bearish.
Price has broken and closed below the PDL (Previous Day Low).
Market structure continues to print Lower Highs and Lower Lows.
Price remains below the EMA and below the descending trendline.
The blue zone around 4325 (Year Open) is now the key support area.
The marked Weak Low liquidity has already been attacked and may be fully swept.
Main Scenario
As long as price stays below 4400-4440, downside pressure remains dominant toward:
4325 (Year Open)
4300
4250
4200
Alternative Scenario
For bulls to regain control, price would need:
a strong recovery above 4400-4440
bullish CHoCH on H4
a close above the trendline and EMA
Until that happens, rallies are likely retracements rather than trend reversals.
Price has broken and closed below the PDL (Previous Day Low).
Market structure continues to print Lower Highs and Lower Lows.
Price remains below the EMA and below the descending trendline.
The blue zone around 4325 (Year Open) is now the key support area.
The marked Weak Low liquidity has already been attacked and may be fully swept.
Main Scenario
As long as price stays below 4400-4440, downside pressure remains dominant toward:
4325 (Year Open)
4300
4250
4200
Alternative Scenario
For bulls to regain control, price would need:
a strong recovery above 4400-4440
bullish CHoCH on H4
a close above the trendline and EMA
Until that happens, rallies are likely retracements rather than trend reversals.
Not
İşlem aktif
What I see on the chartThe primary structure remains bearish (Lower Highs + Lower Lows).
Price has aggressively broken key support levels and reached the major 4325.38 Year Open area.
RSI is in oversold territory (~26), which increases the probability of a technical bounce.
EMA200 remains far above current price (~4550), confirming strong downside pressure.
The descending channel and primary trendline remain intact.
Most likely scenario
1. Bounce before continuation lower
I expect an initial relief rally:
4325 → 4380
possible extension toward 4400-4430
This would likely be a retracement within the broader bearish trend.
2. If 4325 fails
The next downside targets become:
4217 (Reaction Level)
4109
4050
4000 (major psychological level)
This remains the higher-probability scenario as long as price stays below 4475-4500.
What would change the bias?
For a bullish recovery, I would like to see:
Bullish CHoCH on H4
Reclaiming the 4475-4500 zone
H4 candle closes above 4500
Until then, any upward movement appears to be a retracement within a bearish trend.
Not
İşlem kapandı: hedefe ulaştı
This chart strengthens the bearish case.
What I see:
Fast EMA below slow EMA.
Downtrend channel remains intact.
Price lost the 4450-4500 support zone.
Market is approaching the critical 4325 Year Open level.
Major liquidity zones below:
4198
4111
3912
My scenario:
4325 holds → bounce toward 4450-4550.
4325 breaks → 4198 becomes likely.
4198 breaks → 4111.
Strong selling pressure → 3912 →3800.
For gold to reach 5600, bulls would need to reclaim:
4550
4879
5013
5574
then make a new ATH above 5809
That is a very demanding path considering the current structure.
Right now I would be much more surprised to see 5600 this year than to see 4000 first.

Feragatname
Bilgiler ve yayınlar, TradingView tarafından sağlanan veya onaylanan finansal, yatırım, alım satım veya diğer türden tavsiye veya öneriler anlamına gelmez ve teşkil etmez. Kullanım Koşulları bölümünde daha fazlasını okuyun.
Feragatname
Bilgiler ve yayınlar, TradingView tarafından sağlanan veya onaylanan finansal, yatırım, alım satım veya diğer türden tavsiye veya öneriler anlamına gelmez ve teşkil etmez. Kullanım Koşulları bölümünde daha fazlasını okuyun.