
XAUUSD – Weekly Recap: Gold Still Heavy Below 4,100
Gold ended the week under pressure after failing to hold above the 4,100 area.
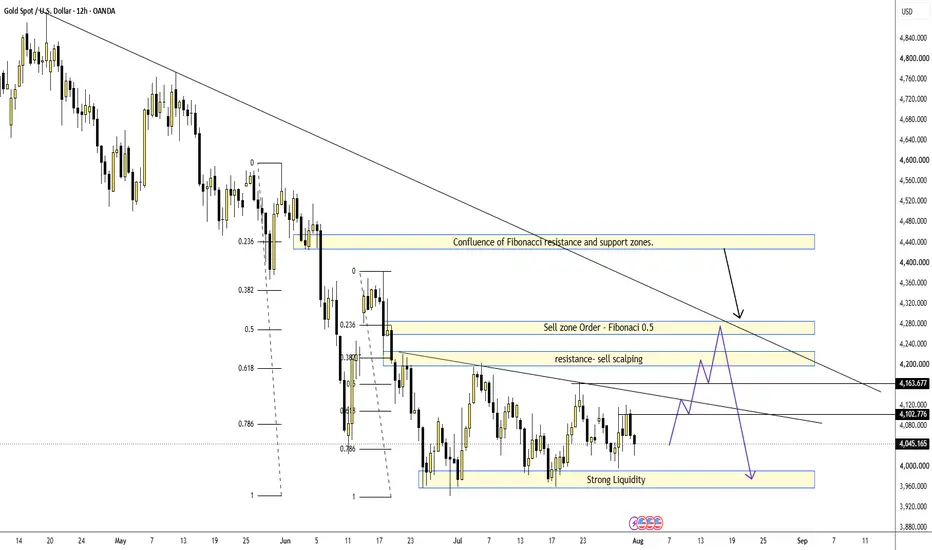
Price is currently trading around 4,045, still below the main resistance structure and inside a broader bearish channel. Although gold has spent several sessions trying to stabilize above the strong liquidity zone, the recovery remains limited.
For now, the chart is clear: buyers are trying to defend the lower range, but sellers still control the larger structure.
WEEKLY TREND SUMMARY
This week, gold moved with a heavy tone.
Earlier in the week, buyers attempted to recover from the lower liquidity area, but price failed to build a strong breakout above 4,100. Every rebound was limited by resistance, showing that bullish momentum was not strong enough.
The rejection below 4,100 became an important signal. After that, gold returned to the lower range and continued to trade near the strong liquidity zone around 3,960 – 4,000.
The weekly structure shows accumulation near support, but not yet a bullish reversal. Gold needs to break higher resistance before the recovery becomes more reliable.
FUNDAMENTAL ANALYSIS
Gold came under pressure as Treasury yields moved higher, offsetting the impact of a weaker U.S. dollar.
Fed members remain divided, but the market is still watching inflation risk closely. Higher oil prices also keep inflation concerns alive, which may support the idea of tighter policy for longer.
This environment can limit gold’s upside because higher yields increase the opportunity cost of holding non-yielding assets.
For now, fundamentals remain mixed, but the technical chart still shows that gold is struggling below key resistance.
TECHNICAL ANALYSIS – SMC + FIBONACCI
From an SMC perspective, gold is still trading inside a broad bearish structure. Price has failed to reclaim the 4,100 area, and the larger descending trendline continues to pressure the market from above.
The strong liquidity zone around 3,960 – 4,000 is the main support area. This zone has helped gold stabilize, but the reaction has not been strong enough to confirm a full reversal.
The first important resistance is around 4,102 – 4,164. If price recovers into this area, it may act as a short-term reaction zone.
Above that, the key sell scalping resistance sits around 4,180 – 4,220. This area aligns with previous structure and may attract sellers again.
The stronger sell order zone is around 4,260 – 4,280, where Fibonacci 0.5 and the broader resistance area are converging. If gold reaches this zone and rejects, the bearish structure may continue.
KEY PRICE ZONES
Current price: 4,045
Strong liquidity support: 3,960 – 4,000
Main support range: 3,960 – 4,045
Short-term resistance: 4,102
Resistance / sell scalping zone: 4,164 – 4,220
Sell order Fibonacci 0.5 zone: 4,260 – 4,280
Higher confluence resistance: 4,430 – 4,450
Bearish structure valid: Below 4,280
Invalidation for sell view: Above 4,280
TRADING SCENARIOS
Buy Scenario – Support Reaction
Buy Zone: 3,960 – 4,000
Entry: Bullish rejection, liquidity sweep, or lower-timeframe CHoCH
SL: Below 3,960
TP1: 4,102
TP2: 4,164
TP3: 4,220
Sell Scenario – Priority Trend View
Sell Zone: 4,164 – 4,220
Entry: Bearish rejection, failed reclaim, or lower-timeframe bearish CHoCH
SL: Above the rejection swing high
TP1: 4,045
TP2: 4,000
TP3: 3,960
Swing Sell Scenario
Sell Zone: 4,260 – 4,280
Entry: Strong rejection from Fibonacci 0.5 and channel resistance
SL: Above 4,280
TP1: 4,164
TP2: 4,045
TP3: 3,960
Breakout Buy
Condition: Break and hold above 4,280
Target: 4,430 – 4,450
MY VIEW
Gold is still heavy, but it is not a clean place to chase sell at the bottom.
The weekly move shows that buyers are trying to defend the strong liquidity zone, but the failure below 4,100 keeps the broader pressure on gold.
For me, the cleaner plan is to wait for reaction.
If gold holds 3,960 – 4,000, a technical recovery toward 4,164 – 4,220 is possible. But if price reaches that resistance and rejects, sellers may return again.
The most important area for next week is 4,260 – 4,280. If gold cannot break this Fibonacci resistance zone, the broader bearish structure remains active.
Gold is trying to stabilize, but the trend has not fully changed yet.
Do you think gold will recover toward 4,280 first, or will sellers break the strong liquidity zone before that?
Gold ended the week under pressure after failing to hold above the 4,100 area.
Price is currently trading around 4,045, still below the main resistance structure and inside a broader bearish channel. Although gold has spent several sessions trying to stabilize above the strong liquidity zone, the recovery remains limited.
For now, the chart is clear: buyers are trying to defend the lower range, but sellers still control the larger structure.
WEEKLY TREND SUMMARY
This week, gold moved with a heavy tone.
Earlier in the week, buyers attempted to recover from the lower liquidity area, but price failed to build a strong breakout above 4,100. Every rebound was limited by resistance, showing that bullish momentum was not strong enough.
The rejection below 4,100 became an important signal. After that, gold returned to the lower range and continued to trade near the strong liquidity zone around 3,960 – 4,000.
The weekly structure shows accumulation near support, but not yet a bullish reversal. Gold needs to break higher resistance before the recovery becomes more reliable.
FUNDAMENTAL ANALYSIS
Gold came under pressure as Treasury yields moved higher, offsetting the impact of a weaker U.S. dollar.
Fed members remain divided, but the market is still watching inflation risk closely. Higher oil prices also keep inflation concerns alive, which may support the idea of tighter policy for longer.
This environment can limit gold’s upside because higher yields increase the opportunity cost of holding non-yielding assets.
For now, fundamentals remain mixed, but the technical chart still shows that gold is struggling below key resistance.
TECHNICAL ANALYSIS – SMC + FIBONACCI
From an SMC perspective, gold is still trading inside a broad bearish structure. Price has failed to reclaim the 4,100 area, and the larger descending trendline continues to pressure the market from above.
The strong liquidity zone around 3,960 – 4,000 is the main support area. This zone has helped gold stabilize, but the reaction has not been strong enough to confirm a full reversal.
The first important resistance is around 4,102 – 4,164. If price recovers into this area, it may act as a short-term reaction zone.
Above that, the key sell scalping resistance sits around 4,180 – 4,220. This area aligns with previous structure and may attract sellers again.
The stronger sell order zone is around 4,260 – 4,280, where Fibonacci 0.5 and the broader resistance area are converging. If gold reaches this zone and rejects, the bearish structure may continue.
KEY PRICE ZONES
Current price: 4,045
Strong liquidity support: 3,960 – 4,000
Main support range: 3,960 – 4,045
Short-term resistance: 4,102
Resistance / sell scalping zone: 4,164 – 4,220
Sell order Fibonacci 0.5 zone: 4,260 – 4,280
Higher confluence resistance: 4,430 – 4,450
Bearish structure valid: Below 4,280
Invalidation for sell view: Above 4,280
TRADING SCENARIOS
Buy Scenario – Support Reaction
Buy Zone: 3,960 – 4,000
Entry: Bullish rejection, liquidity sweep, or lower-timeframe CHoCH
SL: Below 3,960
TP1: 4,102
TP2: 4,164
TP3: 4,220
Sell Scenario – Priority Trend View
Sell Zone: 4,164 – 4,220
Entry: Bearish rejection, failed reclaim, or lower-timeframe bearish CHoCH
SL: Above the rejection swing high
TP1: 4,045
TP2: 4,000
TP3: 3,960
Swing Sell Scenario
Sell Zone: 4,260 – 4,280
Entry: Strong rejection from Fibonacci 0.5 and channel resistance
SL: Above 4,280
TP1: 4,164
TP2: 4,045
TP3: 3,960
Breakout Buy
Condition: Break and hold above 4,280
Target: 4,430 – 4,450
MY VIEW
Gold is still heavy, but it is not a clean place to chase sell at the bottom.
The weekly move shows that buyers are trying to defend the strong liquidity zone, but the failure below 4,100 keeps the broader pressure on gold.
For me, the cleaner plan is to wait for reaction.
If gold holds 3,960 – 4,000, a technical recovery toward 4,164 – 4,220 is possible. But if price reaches that resistance and rejects, sellers may return again.
The most important area for next week is 4,260 – 4,280. If gold cannot break this Fibonacci resistance zone, the broader bearish structure remains active.
Gold is trying to stabilize, but the trend has not fully changed yet.
Do you think gold will recover toward 4,280 first, or will sellers break the strong liquidity zone before that?

Trading is a journey. The destination is mastering yourself
t.me/+qqEvv7Li9Tg2NTE1
t.me/+qqEvv7Li9Tg2NTE1
İlgili yayınlar
Feragatname
Bilgiler ve yayınlar, TradingView tarafından sağlanan veya onaylanan finansal, yatırım, alım satım veya diğer türden tavsiye veya öneriler anlamına gelmez ve teşkil etmez. Kullanım Koşulları bölümünde daha fazlasını okuyun.
Trading is a journey. The destination is mastering yourself
t.me/+qqEvv7Li9Tg2NTE1
t.me/+qqEvv7Li9Tg2NTE1
İlgili yayınlar
Feragatname
Bilgiler ve yayınlar, TradingView tarafından sağlanan veya onaylanan finansal, yatırım, alım satım veya diğer türden tavsiye veya öneriler anlamına gelmez ve teşkil etmez. Kullanım Koşulları bölümünde daha fazlasını okuyun.