
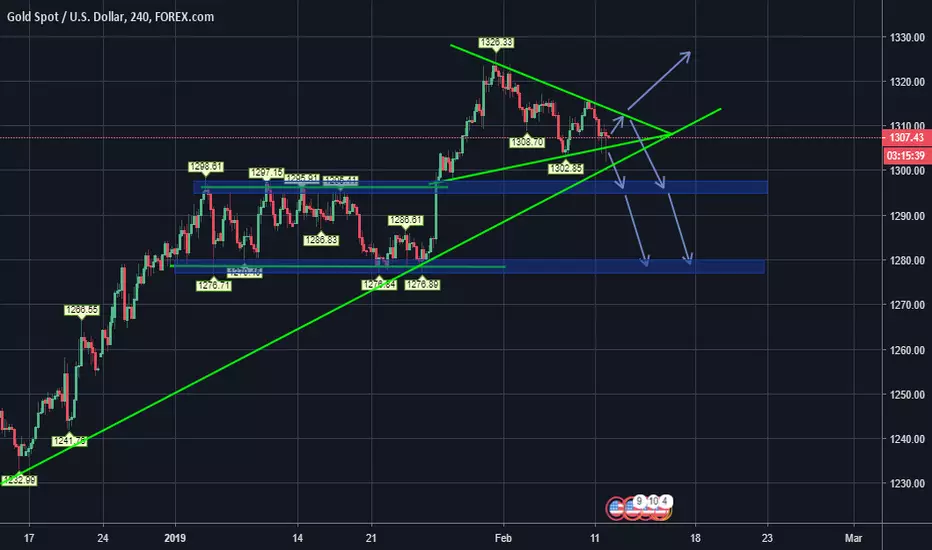
A pennant triangle has formed indicating that price action will break out either above market price or below.
Seeing as gold is currently trading at market highs, the stall in price action suggests it is losing bullish momentum and could therefore break downwards towards precious Support.
Or as due to the longer term bullish trend line it could continue higher to new structure highs and therefore continue bullish trend.
The blue arrows denote possible price action based on the Pennant pattern.
Seeing as gold is currently trading at market highs, the stall in price action suggests it is losing bullish momentum and could therefore break downwards towards precious Support.
Or as due to the longer term bullish trend line it could continue higher to new structure highs and therefore continue bullish trend.
The blue arrows denote possible price action based on the Pennant pattern.
Not
Pennant broke Bullish.
Feragatname
Bilgiler ve yayınlar, TradingView tarafından sağlanan veya onaylanan finansal, yatırım, alım satım veya diğer türden tavsiye veya öneriler anlamına gelmez ve teşkil etmez. Kullanım Koşulları bölümünde daha fazlasını okuyun.
Feragatname
Bilgiler ve yayınlar, TradingView tarafından sağlanan veya onaylanan finansal, yatırım, alım satım veya diğer türden tavsiye veya öneriler anlamına gelmez ve teşkil etmez. Kullanım Koşulları bölümünde daha fazlasını okuyun.