
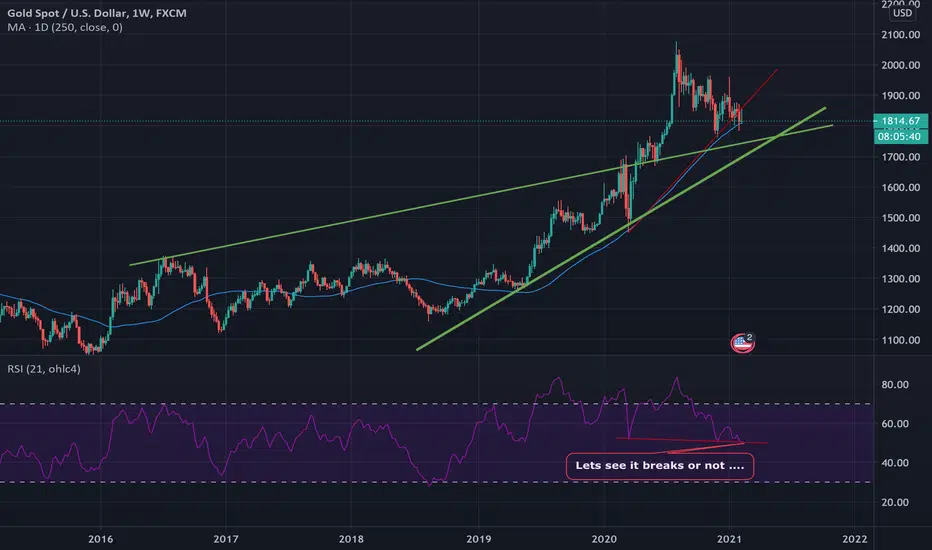
wait for see the price action of weekly canlde against the MA(250) and RSI action Against Red Trend Line
RSI(21) shows us another touch , if Rsi Rejects the Trend Line Below It , a Divergence occurs and price get enough energy to start another bull run.
but if weekly candle closed below daily MA(250) , and RSI red Trend Line break , we should wait for a nice Retracment in price
RSI(21) shows us another touch , if Rsi Rejects the Trend Line Below It , a Divergence occurs and price get enough energy to start another bull run.
but if weekly candle closed below daily MA(250) , and RSI red Trend Line break , we should wait for a nice Retracment in price

that Horizon Beyond Data Flows ...
İlgili yayınlar
Feragatname
Bilgiler ve yayınlar, TradingView tarafından sağlanan veya onaylanan finansal, yatırım, alım satım veya diğer türden tavsiye veya öneriler anlamına gelmez ve teşkil etmez. Kullanım Koşulları bölümünde daha fazlasını okuyun.
that Horizon Beyond Data Flows ...
İlgili yayınlar
Feragatname
Bilgiler ve yayınlar, TradingView tarafından sağlanan veya onaylanan finansal, yatırım, alım satım veya diğer türden tavsiye veya öneriler anlamına gelmez ve teşkil etmez. Kullanım Koşulları bölümünde daha fazlasını okuyun.