
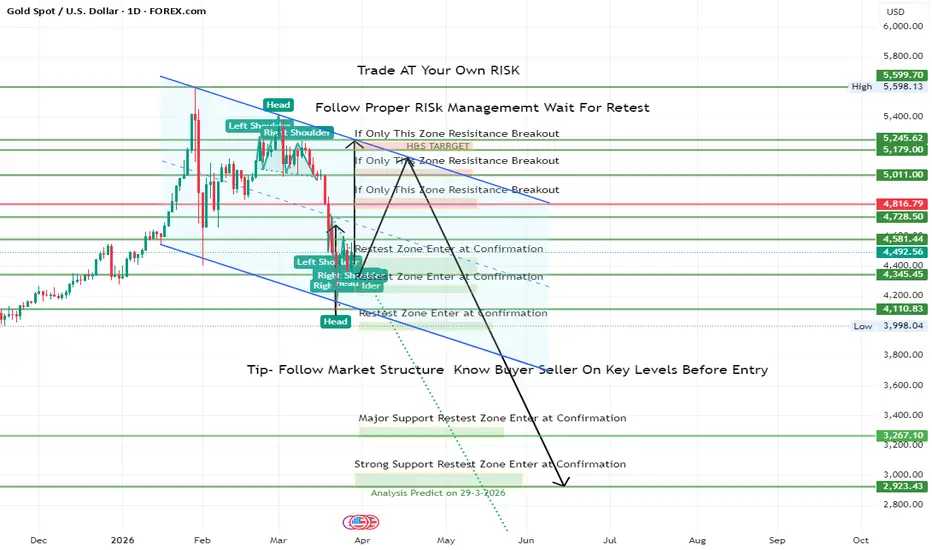
🧩 Market Structure Overview (1D Timeframe)
On the daily chart, XAUUSD formed a Head & Shoulders pattern near major resistance, followed by a descending channel structure.
This indicates a transition from bullish momentum to a distribution and potential markdown phase.
After the neckline break, price moved downward and is now interacting with multiple retest zones, showing how markets often revisit key levels before deciding the next directional move.
🔍 Key Zones to Understand (Educational View)
Primary Resistance Zones: 5011 – 5245 → Decision zones for potential continuation or rejection
Intermediate Zone: 4728 – 4816 → Structure shift and reaction area
Retest / Accumulation Zones: 4345 – 4490 → Monitoring price behavior for confirmation
Major Support Zones: 3267 and 2923 → Long-term structural reference areas
These zones are not predictions — they are reference points to study price behavior and reaction strength.
🧠 Expert Perspective – What This Teaches
Higher timeframe bias controls lower timeframe signals
Chart patterns (like Head & Shoulders) work best when aligned with broader structure
Breakdowns are rarely straight — they involve pullbacks, traps, and retests
Traders who wait for confirmation at key zones reduce emotional decision-making
This case also highlights that:
“A pattern alone is not enough — context and timeframe alignment define its reliability.”
📘 Educational Takeaways
Always begin analysis from higher timeframe structure
Treat breakout zones as decision areas, not entry signals
Understand the role of retests in confirming direction
Focus on process and discipline, not outcomes
⚠️ This is an educational study for learning purposes only. Apply your own analysis and proper risk management before making trading decisions.
#XAUUSD #GoldAnalysis #TechnicalAnalysis #TradingEducation #MarketStructure #PriceAction #TradingPsychology #RiskManagement #MultiTimeframeAnalysis #ChartStudy #YogirajTradingAcademy #MindfulTrading
İşlem kapandı: hedefe ulaştı
Not
Market Following Same Directional BiasNot

İlgili yayınlar
Feragatname
Bilgiler ve yayınlar, TradingView tarafından sağlanan veya onaylanan finansal, yatırım, alım satım veya diğer türden tavsiye veya öneriler anlamına gelmez ve teşkil etmez. Kullanım Koşulları bölümünde daha fazlasını okuyun.
İlgili yayınlar
Feragatname
Bilgiler ve yayınlar, TradingView tarafından sağlanan veya onaylanan finansal, yatırım, alım satım veya diğer türden tavsiye veya öneriler anlamına gelmez ve teşkil etmez. Kullanım Koşulları bölümünde daha fazlasını okuyun.