
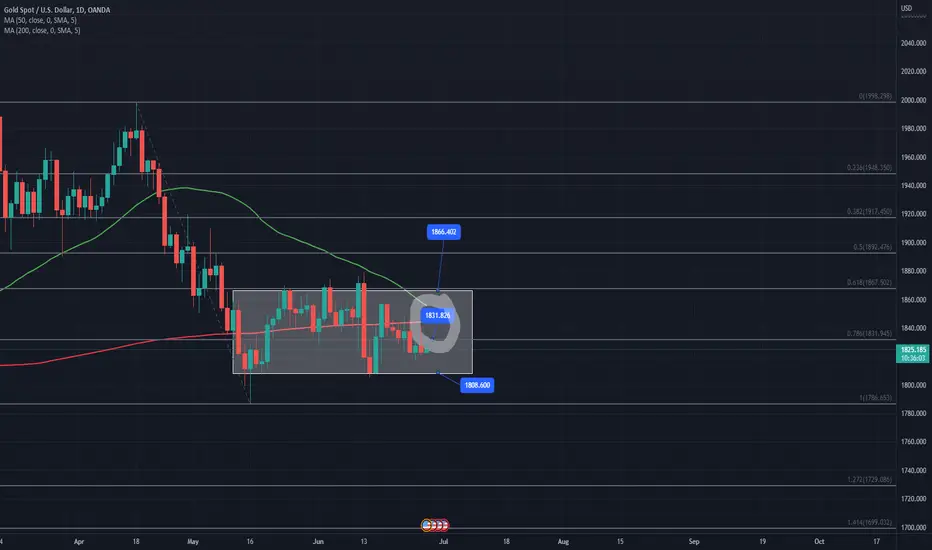
50 MA --> 🟢
200 MA --> 🔴
What is Death Cross ?
The death cross is a chart pattern that signals a growing weakness in an asset's price. It comprises two separate lines called “moving averages.” Each moving average line (MA) is formed by calculating the average price over a certain period of time and using those points to create a smoothed line.
An example of a death cross is circled in gray.
If you want to see indicator signals:
Median : Sell
Parabolic SAR : Sell
SuperTrend : Sell
Awesome Ossillator : Sell
Williams Alligator : Sell
Support Level :
🛑1805-1810
Resistance Level :
🎯1830
🎯1865
Not Financial Advice
200 MA --> 🔴
What is Death Cross ?
The death cross is a chart pattern that signals a growing weakness in an asset's price. It comprises two separate lines called “moving averages.” Each moving average line (MA) is formed by calculating the average price over a certain period of time and using those points to create a smoothed line.
An example of a death cross is circled in gray.
If you want to see indicator signals:
Median : Sell
Parabolic SAR : Sell
SuperTrend : Sell
Awesome Ossillator : Sell
Williams Alligator : Sell
Support Level :
🛑1805-1810
Resistance Level :
🎯1830
🎯1865
Not Financial Advice

Feragatname
Bilgiler ve yayınlar, TradingView tarafından sağlanan veya onaylanan finansal, yatırım, alım satım veya diğer türden tavsiye veya öneriler anlamına gelmez ve teşkil etmez. Kullanım Koşulları bölümünde daha fazlasını okuyun.
Feragatname
Bilgiler ve yayınlar, TradingView tarafından sağlanan veya onaylanan finansal, yatırım, alım satım veya diğer türden tavsiye veya öneriler anlamına gelmez ve teşkil etmez. Kullanım Koşulları bölümünde daha fazlasını okuyun.