
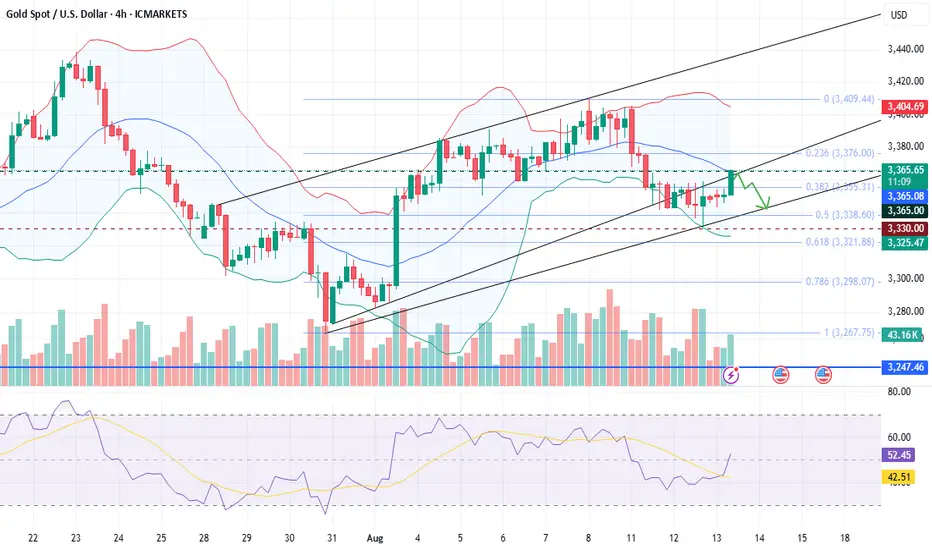
Price Action: Gold's primary bullish trend has paused, with prices consolidating between $3342 and $3360 on the 4-hour chart since Monday. Despite a recent rise due to a weaker dollar, strong resistance at $3365 and an ascending trendline halted the rally. A potential correction could occur if prices fall below the $3355 Fibonacci level.
Biasness: Gold is benefiting from a weaker U.S. dollar after soft inflation data boosted expectations for a Fed rate cut. Lower rates increase gold’s attractiveness as a non-yielding asset. Political uncertainty in the U.S. further supports safe-haven demand.
Key Levels: R1- 3365 R2- 3400
S1- 3350 S2- 3330
Technical Analysis: Prices are testing the middle Bollinger band near strong resistance at $3365. The RSI also rose strongly, signaling exhaustion of bullish strength. Overall, technical indicators are signaling bearish pressure building
Data Releases: With no major data releases today, traders are focused on tomorrow’s U.S. PPI report. Gold stays supported as rate cut expectations and dollar weakness maintain bullish sentiment.
Alternative Scenario: If Gold rise above the crucial resistance level of 3365, then it could signal bullishness.
While writing the report, gold is trending at 3359
Biasness: Gold is benefiting from a weaker U.S. dollar after soft inflation data boosted expectations for a Fed rate cut. Lower rates increase gold’s attractiveness as a non-yielding asset. Political uncertainty in the U.S. further supports safe-haven demand.
Key Levels: R1- 3365 R2- 3400
S1- 3350 S2- 3330
Technical Analysis: Prices are testing the middle Bollinger band near strong resistance at $3365. The RSI also rose strongly, signaling exhaustion of bullish strength. Overall, technical indicators are signaling bearish pressure building
Data Releases: With no major data releases today, traders are focused on tomorrow’s U.S. PPI report. Gold stays supported as rate cut expectations and dollar weakness maintain bullish sentiment.
Alternative Scenario: If Gold rise above the crucial resistance level of 3365, then it could signal bullishness.
While writing the report, gold is trending at 3359

Feragatname
Bilgiler ve yayınlar, TradingView tarafından sağlanan veya onaylanan finansal, yatırım, alım satım veya diğer türden tavsiye veya öneriler anlamına gelmez ve teşkil etmez. Kullanım Koşulları bölümünde daha fazlasını okuyun.
Feragatname
Bilgiler ve yayınlar, TradingView tarafından sağlanan veya onaylanan finansal, yatırım, alım satım veya diğer türden tavsiye veya öneriler anlamına gelmez ve teşkil etmez. Kullanım Koşulları bölümünde daha fazlasını okuyun.