
Hey there!
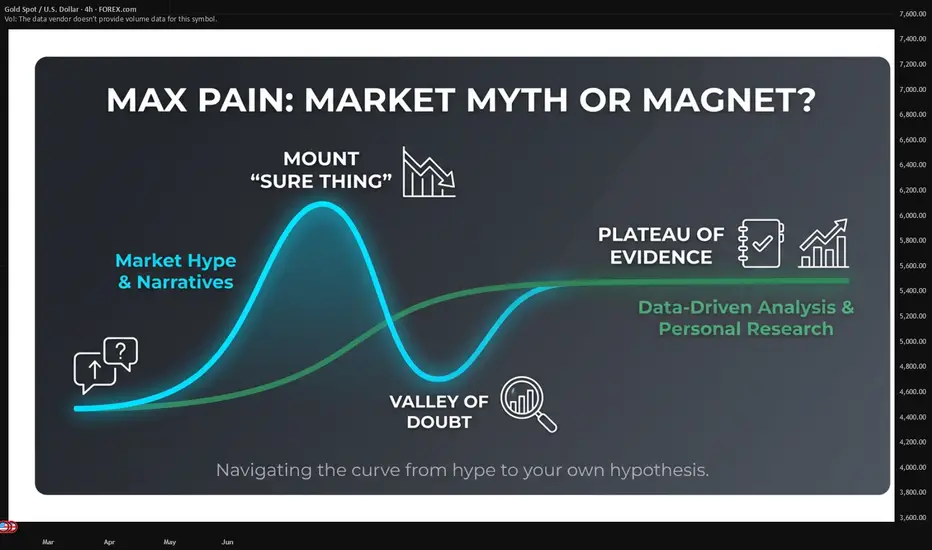
Ever get the feeling the market is playing games with you? That right when you place a trade, price seems to be drawn to a specific level like a magnet, only to reverse exactly there? Traders often whisper about "Max Pain" – a level that supposedly causes maximum financial "pain" to option buyers at expiration. It sounds almost mythical, right? A secret force guiding the market.
I've been diving deep into this rabbit hole myself, and today, I want to share the basics with you. Not as a guru with all the answers, but as a curious trader on the same journey of discovery. I won't tell you whether to believe in its power. Instead, I'll give you the map so you can explore this territory yourself.
What is Max Pain? The Simple Math Behind the Mystery
Let's strip away the mystique. Max Pain is a specific stock or asset price at which the total value of all open options (puts and calls) would suffer the maximum collective loss for option buyers/holders at the moment of expiration.
How is it calculated? It's not magic, it's arithmetic:
- For each available strike price, you calculate the total dollar loss for option buyers if the underlying asset settles at that strike at expiration.
- You sum the losses for all open puts and calls at that strike.
- The strike price with the highest total loss for option buyers is the Max Pain level.
Simple example for illustration: Imagine most traders bought calls at $100 and puts at $95. If the price is exactly at $98 at expiration, both the call and put buyers lose. The writers (sellers) keep the premiums. $98 could well be the Max Pain point.
The hypothesis is that market makers and large players, who are typically net sellers of options, may have an incentive to influence the price toward this level to minimize their own potential payouts (by maximizing losses for the buyers). This is where the theory of "price attraction" comes from.
The Great Debate: Magnet or Mirage?
This is where it gets interesting. The community is sharply divided.
The Believers: They see Max Pain as a powerful "magnet," especially in the days leading up to expiration (OpEx). They point to countless charts where price seems to gravitate and even pin exactly at that level on Friday.
The Skeptics: They argue it's a self-fulfilling prophecy or mere coincidence. If enough people watch a level, their collective action (take-profit, stop-loss orders) can create support/resistance, not some hidden force.
So, who's right? This is exactly the question that should drive our research, not blind faith in market hypnosis.
A Nudge from Academia: "No Max Pain, No Max Gain"
This isn't just trader lore. Serious academics are studying it. A recent and very compelling paper titled "No Max Pain, No Max Gain: A Case of Predictable Reversal" by Ilias Filippou and Pedro A. Garcia-Ares (September 30, 2024) investigated this phenomenon on the stock market.
Their key finding? Stocks whose prices were above the Max Pain level ahead of expiration showed a statistically significant tendency to move down toward it, and vice-versa for stocks below it. They documented a predictable "reversal" effect. This is a powerful piece of evidence that the effect might be real and measurable, at least in equities but not for all stocks.
But here's the critical thought: does this apply to metals, indices, or Forex, where the option market structure is different? That's a wide-open question.
Your Journey, Your Edge: Become a Data Detective
This is the core of my message to you. Don't just take my word for it, or anyone else's. The greatest edge in trading comes from your own conviction, built on your own analysis.
Here’s how you can start your own investigation:
1. Identify the Levels: First, you need reliable Max Pain data for your traded asset. These levels are recalculated daily as open interest changes.
2. Gather Evidence: Start a trading journal. Note the Max Pain level at the start of the OpEx week. Observe where price closes on expiration day. Don't just look for confirmations; actively note the exceptions.
3. Ask Specific Questions: Is the "attraction" stronger for NASDAQ stocks than for gold? Does it work better in trending or ranging markets? Is the effect stronger on quarterly "triple witching" expirations?
4. Collect Your Own Statistics: Track 20, 50, 100 expiration events. What percentage of the time did price close within 0.5% of Max Pain? Was there a mean-reversion effect as the academic paper suggests?
Conclusion:
I started this journey recently, focusing on metals and major currency pairs. I'm systematically collecting data, drawing my charts, and keeping my own journal. I don't have a definitive answer yet. Maybe the "magnet" is strong in some assets and weak in others. Maybe it's a self-fulfilling prophecy we can still trade.
But one thing I'm sure of: passively believing or dismissing market narratives is a dead end. The active path of observation, data collection, and critical thinking is what separates a spectator from a strategist.
So, I invite you to become a market researcher. Test the Max Pain hypothesis yourself. See if these levels whisper secrets to you, or if they remain silent. Your own collected data will be your most trusted advisor.
Happy charting, and may your curiosity be your most profitable indicator!
P.S. If you're interested in seeing how these levels shift daily but you don't have time and skills to collect data, you can still track them I plot them daily (take a look TradingView bio).
Ever get the feeling the market is playing games with you? That right when you place a trade, price seems to be drawn to a specific level like a magnet, only to reverse exactly there? Traders often whisper about "Max Pain" – a level that supposedly causes maximum financial "pain" to option buyers at expiration. It sounds almost mythical, right? A secret force guiding the market.
I've been diving deep into this rabbit hole myself, and today, I want to share the basics with you. Not as a guru with all the answers, but as a curious trader on the same journey of discovery. I won't tell you whether to believe in its power. Instead, I'll give you the map so you can explore this territory yourself.
What is Max Pain? The Simple Math Behind the Mystery
Let's strip away the mystique. Max Pain is a specific stock or asset price at which the total value of all open options (puts and calls) would suffer the maximum collective loss for option buyers/holders at the moment of expiration.
How is it calculated? It's not magic, it's arithmetic:
- For each available strike price, you calculate the total dollar loss for option buyers if the underlying asset settles at that strike at expiration.
- You sum the losses for all open puts and calls at that strike.
- The strike price with the highest total loss for option buyers is the Max Pain level.
Simple example for illustration: Imagine most traders bought calls at $100 and puts at $95. If the price is exactly at $98 at expiration, both the call and put buyers lose. The writers (sellers) keep the premiums. $98 could well be the Max Pain point.
The hypothesis is that market makers and large players, who are typically net sellers of options, may have an incentive to influence the price toward this level to minimize their own potential payouts (by maximizing losses for the buyers). This is where the theory of "price attraction" comes from.
The Great Debate: Magnet or Mirage?
This is where it gets interesting. The community is sharply divided.
The Believers: They see Max Pain as a powerful "magnet," especially in the days leading up to expiration (OpEx). They point to countless charts where price seems to gravitate and even pin exactly at that level on Friday.
The Skeptics: They argue it's a self-fulfilling prophecy or mere coincidence. If enough people watch a level, their collective action (take-profit, stop-loss orders) can create support/resistance, not some hidden force.
So, who's right? This is exactly the question that should drive our research, not blind faith in market hypnosis.
A Nudge from Academia: "No Max Pain, No Max Gain"
This isn't just trader lore. Serious academics are studying it. A recent and very compelling paper titled "No Max Pain, No Max Gain: A Case of Predictable Reversal" by Ilias Filippou and Pedro A. Garcia-Ares (September 30, 2024) investigated this phenomenon on the stock market.
Their key finding? Stocks whose prices were above the Max Pain level ahead of expiration showed a statistically significant tendency to move down toward it, and vice-versa for stocks below it. They documented a predictable "reversal" effect. This is a powerful piece of evidence that the effect might be real and measurable, at least in equities but not for all stocks.
But here's the critical thought: does this apply to metals, indices, or Forex, where the option market structure is different? That's a wide-open question.
Your Journey, Your Edge: Become a Data Detective
This is the core of my message to you. Don't just take my word for it, or anyone else's. The greatest edge in trading comes from your own conviction, built on your own analysis.
Here’s how you can start your own investigation:
1. Identify the Levels: First, you need reliable Max Pain data for your traded asset. These levels are recalculated daily as open interest changes.
2. Gather Evidence: Start a trading journal. Note the Max Pain level at the start of the OpEx week. Observe where price closes on expiration day. Don't just look for confirmations; actively note the exceptions.
3. Ask Specific Questions: Is the "attraction" stronger for NASDAQ stocks than for gold? Does it work better in trending or ranging markets? Is the effect stronger on quarterly "triple witching" expirations?
4. Collect Your Own Statistics: Track 20, 50, 100 expiration events. What percentage of the time did price close within 0.5% of Max Pain? Was there a mean-reversion effect as the academic paper suggests?
Conclusion:
I started this journey recently, focusing on metals and major currency pairs. I'm systematically collecting data, drawing my charts, and keeping my own journal. I don't have a definitive answer yet. Maybe the "magnet" is strong in some assets and weak in others. Maybe it's a self-fulfilling prophecy we can still trade.
But one thing I'm sure of: passively believing or dismissing market narratives is a dead end. The active path of observation, data collection, and critical thinking is what separates a spectator from a strategist.
So, I invite you to become a market researcher. Test the Max Pain hypothesis yourself. See if these levels whisper secrets to you, or if they remain silent. Your own collected data will be your most trusted advisor.
Happy charting, and may your curiosity be your most profitable indicator!
P.S. If you're interested in seeing how these levels shift daily but you don't have time and skills to collect data, you can still track them I plot them daily (take a look TradingView bio).

İlgili yayınlar
Feragatname
Bilgiler ve yayınlar, TradingView tarafından sağlanan veya onaylanan finansal, yatırım, alım satım veya diğer türden tavsiye veya öneriler anlamına gelmez ve teşkil etmez. Kullanım Koşulları bölümünde daha fazlasını okuyun.
İlgili yayınlar
Feragatname
Bilgiler ve yayınlar, TradingView tarafından sağlanan veya onaylanan finansal, yatırım, alım satım veya diğer türden tavsiye veya öneriler anlamına gelmez ve teşkil etmez. Kullanım Koşulları bölümünde daha fazlasını okuyun.