
Market Analysis:
On Wednesday (July 1st) during the Asian trading session, spot gold prices hovered around $3980 per ounce, continuing the recent sideways consolidation pattern. However, international gold's performance in the second quarter still saw its largest drop in 13 years, mainly due to concerns about rising inflation triggered by the Middle East conflict, which is strengthening the possibility of a Federal Reserve interest rate hike. A series of US employment data released this week will be a crucial catalyst for determining the short-term direction of London gold prices.
As Friday is the US Independence Day holiday, non-farm payroll data will be released a day earlier than usual. Without a clear breakout signal, gold prices are expected to maintain a high-level consolidation structure. If future employment data significantly strengthens expectations of continued high interest rates, gold may face pressure for a phased correction; conversely, if economic data weakens, it is expected to reactivate the safe-haven and interest rate cut trading logic, pushing prices back into an upward channel.
Technical Analysis:
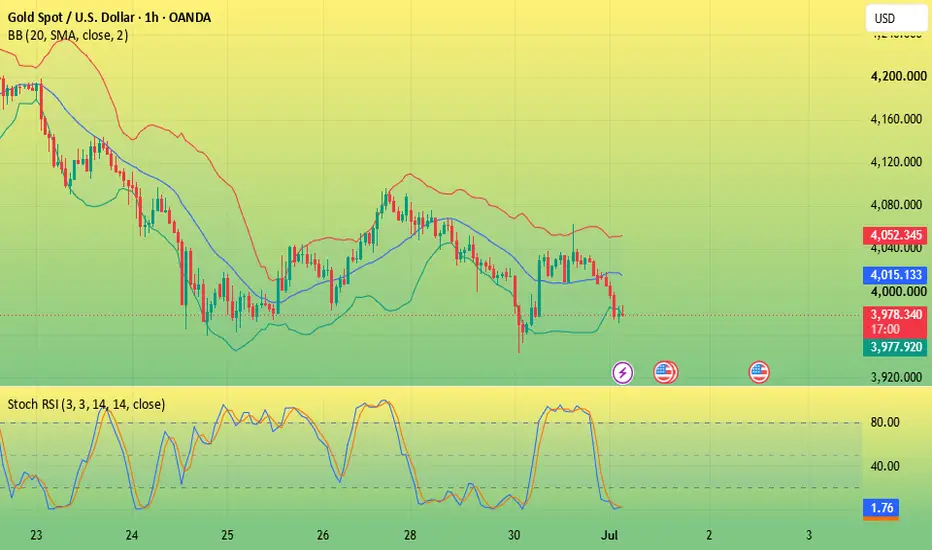
Yesterday, gold experienced a sharp one-sided decline, breaking through the key $4000 level, reaching a low of $3941, before a slight oversold rebound at the close. The current long-term downtrend is established. The Asian session rebound is merely a weak technical correction, lacking upward momentum and showing no reversal signals. The strategy should focus on selling on rallies, with only small long positions at lower levels for short-term profit-taking. Avoid blindly chasing the market. Technically, the daily chart shows a long lower shadow candlestick after a bottoming out and rebound, with continued downward pressure from the 10-day and 7-day moving averages (MA10/4035). The RSI indicator remains around the 50 level, and the daily chart is trading within the lower Bollinger Band channel. On the short-term hourly and 4-hour charts, the moving averages are converging, and the Bollinger Bands are narrowing and flattening. The short-term trading strategy is to continue the range-bound movement, prioritizing selling on rallies and using buying on dips as a secondary approach.
Trading Strategy:
Buy gold at 3900-3910, with a stop-loss at 3870, and a target of 3970-4000;
Sell gold at 4020-4030, with a stop-loss at 4060, and a target of 3930-3900.
On Wednesday (July 1st) during the Asian trading session, spot gold prices hovered around $3980 per ounce, continuing the recent sideways consolidation pattern. However, international gold's performance in the second quarter still saw its largest drop in 13 years, mainly due to concerns about rising inflation triggered by the Middle East conflict, which is strengthening the possibility of a Federal Reserve interest rate hike. A series of US employment data released this week will be a crucial catalyst for determining the short-term direction of London gold prices.
As Friday is the US Independence Day holiday, non-farm payroll data will be released a day earlier than usual. Without a clear breakout signal, gold prices are expected to maintain a high-level consolidation structure. If future employment data significantly strengthens expectations of continued high interest rates, gold may face pressure for a phased correction; conversely, if economic data weakens, it is expected to reactivate the safe-haven and interest rate cut trading logic, pushing prices back into an upward channel.
Technical Analysis:
Yesterday, gold experienced a sharp one-sided decline, breaking through the key $4000 level, reaching a low of $3941, before a slight oversold rebound at the close. The current long-term downtrend is established. The Asian session rebound is merely a weak technical correction, lacking upward momentum and showing no reversal signals. The strategy should focus on selling on rallies, with only small long positions at lower levels for short-term profit-taking. Avoid blindly chasing the market. Technically, the daily chart shows a long lower shadow candlestick after a bottoming out and rebound, with continued downward pressure from the 10-day and 7-day moving averages (MA10/4035). The RSI indicator remains around the 50 level, and the daily chart is trading within the lower Bollinger Band channel. On the short-term hourly and 4-hour charts, the moving averages are converging, and the Bollinger Bands are narrowing and flattening. The short-term trading strategy is to continue the range-bound movement, prioritizing selling on rallies and using buying on dips as a secondary approach.
Trading Strategy:
Buy gold at 3900-3910, with a stop-loss at 3870, and a target of 3970-4000;
Sell gold at 4020-4030, with a stop-loss at 4060, and a target of 3930-3900.

Feragatname
Bilgiler ve yayınlar, TradingView tarafından sağlanan veya onaylanan finansal, yatırım, alım satım veya diğer türden tavsiye veya öneriler anlamına gelmez ve teşkil etmez. Kullanım Koşulları bölümünde daha fazlasını okuyun.
Feragatname
Bilgiler ve yayınlar, TradingView tarafından sağlanan veya onaylanan finansal, yatırım, alım satım veya diğer türden tavsiye veya öneriler anlamına gelmez ve teşkil etmez. Kullanım Koşulları bölümünde daha fazlasını okuyun.