
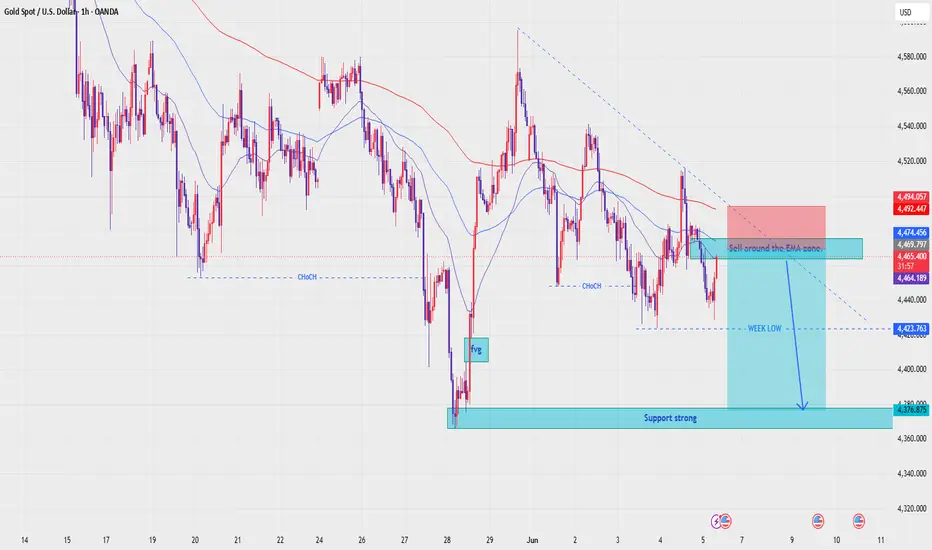
EMA Resistance Holds, Bearish Continuation Toward Weekly Liquidity
Fundamental Analysis
Gold remains in a cautious trading environment as the market continues to react to U.S. dollar movement, Treasury yields, and upcoming U.S. economic data. Any change in Fed rate expectations may create short-term volatility, especially around liquidity zones.
For now, gold has not shown enough strength to confirm a clean bullish reversal. The price is still trading under key EMA resistance, and the current structure suggests that recovery attempts may continue to be treated as pullbacks inside a bearish market phase.
Technical Analysis
On the 1H chart, XAUUSD is still moving below the EMA 34, EMA 89, and EMA 200 structure. The EMA cluster around 4,464 - 4,494 is acting as a dynamic resistance zone, and the recent reaction shows that sellers are still active around this area.
The descending trendline from the previous swing high also supports the bearish view. Price recently pushed into the EMA zone but failed to hold above it with conviction. This rejection keeps the short-term structure aligned with the downside.
From an ICT perspective, the chart shows a clear bearish delivery model. Price has already reacted from the EMA resistance area, while the week low around 4,423 remains the nearest downside liquidity. Below that, the stronger support and liquidity pool is located near 4,376.
The previous CHoCH zones show that the market has already shifted lower several times. As long as price stays below the EMA resistance and below the descending trendline, the main view remains bearish. The cleaner plan is to wait for price to retest the EMA zone, then look for sell confirmation instead of chasing price at the lows.
Important Key Levels
EMA resistance zone: 4,464 - 4,494
Sell reaction area: 4,464 - 4,474
Upper invalidation area: 4,494 - 4,505
Short-term support: 4,440 - 4,423
Week low liquidity: 4,423
Strong support zone: 4,376 - 4,370
Main downside target: 4,376
Trading Scenario
Main Sell Scenario
Entry: 4,464 - 4,474
Stop Loss: 4,505
Take Profit 1: 4,440
Take Profit 2: 4,423
Take Profit 3: 4,376
Sell Condition
The preferred sell setup is to wait for price to pull back into the EMA resistance zone around 4,464 - 4,474. This area is aligned with the EMA 34/89 reaction zone and the bearish trendline structure.
A sell setup becomes more valid if price shows bearish rejection from this zone, such as a long upper wick, bearish engulfing candle, failed breakout, or lower high formation below the EMA 200.
If price breaks below 4,440 with clear bearish displacement, the next liquidity target is the week low around 4,423. A deeper continuation may then aim for the strong support zone near 4,376.
Alternative Scenario — Invalidation Only
This is not the main buy view. However, if gold closes strongly above 4,505 and holds above the EMA cluster, the bearish setup should be considered invalid. In that case, price may attempt a stronger recovery before a new structure forms.
Entry Conditions
Do not sell only because price touches the EMA zone.
Wait for clear rejection or bearish price action confirmation.
Avoid chasing sell entries when price is already close to the week low.
The cleanest sell setup is a pullback into EMA resistance followed by rejection.
If price breaks and holds above 4,505, the bearish setup should be removed.
Risk management is important because gold can sweep liquidity before continuing in the main direction.
Overall, the main view remains bearish while XAUUSD stays below EMA 34, EMA 89, EMA 200, and the descending trendline. The preferred plan is to wait for a controlled pullback into the EMA zone and look for sell confirmation toward 4,423 and 4,376.
Do you share the same bearish view on gold, or are you waiting for another confirmation before taking a position?
Fundamental Analysis
Gold remains in a cautious trading environment as the market continues to react to U.S. dollar movement, Treasury yields, and upcoming U.S. economic data. Any change in Fed rate expectations may create short-term volatility, especially around liquidity zones.
For now, gold has not shown enough strength to confirm a clean bullish reversal. The price is still trading under key EMA resistance, and the current structure suggests that recovery attempts may continue to be treated as pullbacks inside a bearish market phase.
Technical Analysis
On the 1H chart, XAUUSD is still moving below the EMA 34, EMA 89, and EMA 200 structure. The EMA cluster around 4,464 - 4,494 is acting as a dynamic resistance zone, and the recent reaction shows that sellers are still active around this area.
The descending trendline from the previous swing high also supports the bearish view. Price recently pushed into the EMA zone but failed to hold above it with conviction. This rejection keeps the short-term structure aligned with the downside.
From an ICT perspective, the chart shows a clear bearish delivery model. Price has already reacted from the EMA resistance area, while the week low around 4,423 remains the nearest downside liquidity. Below that, the stronger support and liquidity pool is located near 4,376.
The previous CHoCH zones show that the market has already shifted lower several times. As long as price stays below the EMA resistance and below the descending trendline, the main view remains bearish. The cleaner plan is to wait for price to retest the EMA zone, then look for sell confirmation instead of chasing price at the lows.
Important Key Levels
EMA resistance zone: 4,464 - 4,494
Sell reaction area: 4,464 - 4,474
Upper invalidation area: 4,494 - 4,505
Short-term support: 4,440 - 4,423
Week low liquidity: 4,423
Strong support zone: 4,376 - 4,370
Main downside target: 4,376
Trading Scenario
Main Sell Scenario
Entry: 4,464 - 4,474
Stop Loss: 4,505
Take Profit 1: 4,440
Take Profit 2: 4,423
Take Profit 3: 4,376
Sell Condition
The preferred sell setup is to wait for price to pull back into the EMA resistance zone around 4,464 - 4,474. This area is aligned with the EMA 34/89 reaction zone and the bearish trendline structure.
A sell setup becomes more valid if price shows bearish rejection from this zone, such as a long upper wick, bearish engulfing candle, failed breakout, or lower high formation below the EMA 200.
If price breaks below 4,440 with clear bearish displacement, the next liquidity target is the week low around 4,423. A deeper continuation may then aim for the strong support zone near 4,376.
Alternative Scenario — Invalidation Only
This is not the main buy view. However, if gold closes strongly above 4,505 and holds above the EMA cluster, the bearish setup should be considered invalid. In that case, price may attempt a stronger recovery before a new structure forms.
Entry Conditions
Do not sell only because price touches the EMA zone.
Wait for clear rejection or bearish price action confirmation.
Avoid chasing sell entries when price is already close to the week low.
The cleanest sell setup is a pullback into EMA resistance followed by rejection.
If price breaks and holds above 4,505, the bearish setup should be removed.
Risk management is important because gold can sweep liquidity before continuing in the main direction.
Overall, the main view remains bearish while XAUUSD stays below EMA 34, EMA 89, EMA 200, and the descending trendline. The preferred plan is to wait for a controlled pullback into the EMA zone and look for sell confirmation toward 4,423 and 4,376.
Do you share the same bearish view on gold, or are you waiting for another confirmation before taking a position?
İşlem kapandı: hedefe ulaştı
Full TP 
📊 XAU Macro Pulse · XAUUSD · GBPUSD · EURUSD
Every setup earns its place on the chart.
🔔 Follow the structure. The rest is noise.
Personal analysis only t.me/+TxpetmVvKGhjZDhl
Every setup earns its place on the chart.
🔔 Follow the structure. The rest is noise.
Personal analysis only t.me/+TxpetmVvKGhjZDhl
İlgili yayınlar
Feragatname
Bilgiler ve yayınlar, TradingView tarafından sağlanan veya onaylanan finansal, yatırım, alım satım veya diğer türden tavsiye veya öneriler anlamına gelmez ve teşkil etmez. Kullanım Koşulları bölümünde daha fazlasını okuyun.
📊 XAU Macro Pulse · XAUUSD · GBPUSD · EURUSD
Every setup earns its place on the chart.
🔔 Follow the structure. The rest is noise.
Personal analysis only t.me/+TxpetmVvKGhjZDhl
Every setup earns its place on the chart.
🔔 Follow the structure. The rest is noise.
Personal analysis only t.me/+TxpetmVvKGhjZDhl
İlgili yayınlar
Feragatname
Bilgiler ve yayınlar, TradingView tarafından sağlanan veya onaylanan finansal, yatırım, alım satım veya diğer türden tavsiye veya öneriler anlamına gelmez ve teşkil etmez. Kullanım Koşulları bölümünde daha fazlasını okuyun.