Market Analysis: Gold Price Slides
Market Analysis: Gold Price Slides
Gold price extended losses below $4,100 before the bulls appeared.
Important Takeaways for Gold Price Analysis Today
- Gold price failed to clear $4,250 and corrected lower against the US Dollar.
- There was a break above a key bearish trend line with resistance at $4,050 on the hourly chart of gold.
Gold Price Technical Analysis
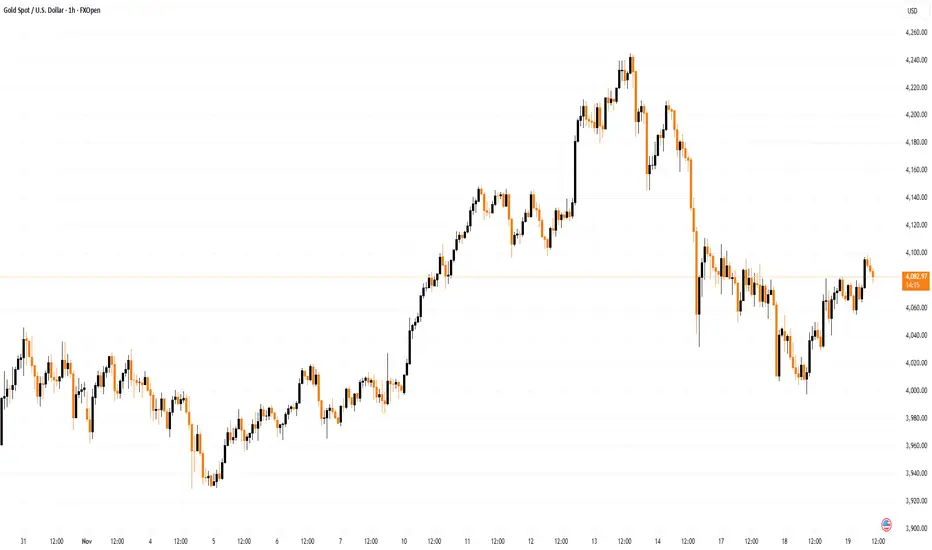
On the hourly chart of Gold, the price was able to climb above $4,200. The price even broke $4,220 before the bears appeared. The price traded toward $4,245 before there was a fresh decline.
There was a move below $4,200 and $4,100. The price settled below the 50-hour simple moving average, and RSI dipped below 40. Finally, it tested the $4,000 handle. A low was formed at $3,997 and the price is now attempting to recover.

There was a break above a key bearish trend line with resistance at $4,050. The price climbed above the 23.6% Fib retracement level of the downward move from the $4,244 swing high to the $3,997 low.
Immediate resistance on the upside is $4,100. The first major hurdle sits at $4,150 and the 61.8% Fib retracement. A close above $4,150 could initiate a recovery wave to $4,185. An upside break above $4,185 could send Gold price toward $4,250. Any more gains may perhaps set the pace for an increase toward $4,320.
If there is no recovery wave, the price could continue to move down. Initial support on the downside is near the $4,050 level. The first key area of interest might be $4,000. If there is a downside break below $4,000, the price might decline further. In the stated case, the price might drop to $3,880.
This article represents the opinion of the Companies operating under the FXOpen brand only. It is not to be construed as an offer, solicitation, or recommendation with respect to products and services provided by the Companies operating under the FXOpen brand, nor is it to be considered financial advice.
Gold price extended losses below $4,100 before the bulls appeared.
Important Takeaways for Gold Price Analysis Today
- Gold price failed to clear $4,250 and corrected lower against the US Dollar.
- There was a break above a key bearish trend line with resistance at $4,050 on the hourly chart of gold.
Gold Price Technical Analysis
On the hourly chart of Gold, the price was able to climb above $4,200. The price even broke $4,220 before the bears appeared. The price traded toward $4,245 before there was a fresh decline.
There was a move below $4,200 and $4,100. The price settled below the 50-hour simple moving average, and RSI dipped below 40. Finally, it tested the $4,000 handle. A low was formed at $3,997 and the price is now attempting to recover.
There was a break above a key bearish trend line with resistance at $4,050. The price climbed above the 23.6% Fib retracement level of the downward move from the $4,244 swing high to the $3,997 low.
Immediate resistance on the upside is $4,100. The first major hurdle sits at $4,150 and the 61.8% Fib retracement. A close above $4,150 could initiate a recovery wave to $4,185. An upside break above $4,185 could send Gold price toward $4,250. Any more gains may perhaps set the pace for an increase toward $4,320.
If there is no recovery wave, the price could continue to move down. Initial support on the downside is near the $4,050 level. The first key area of interest might be $4,000. If there is a downside break below $4,000, the price might decline further. In the stated case, the price might drop to $3,880.
This article represents the opinion of the Companies operating under the FXOpen brand only. It is not to be construed as an offer, solicitation, or recommendation with respect to products and services provided by the Companies operating under the FXOpen brand, nor is it to be considered financial advice.

Feragatname
Bilgiler ve yayınlar, TradingView tarafından sağlanan veya onaylanan finansal, yatırım, alım satım veya diğer türden tavsiye veya öneriler anlamına gelmez ve teşkil etmez. Kullanım Koşulları bölümünde daha fazlasını okuyun.
Feragatname
Bilgiler ve yayınlar, TradingView tarafından sağlanan veya onaylanan finansal, yatırım, alım satım veya diğer türden tavsiye veya öneriler anlamına gelmez ve teşkil etmez. Kullanım Koşulları bölümünde daha fazlasını okuyun.