
🧹 XAUUSD Liquidity Sweep: Why a Wick Below Support Is NOT a Breakdown 📈
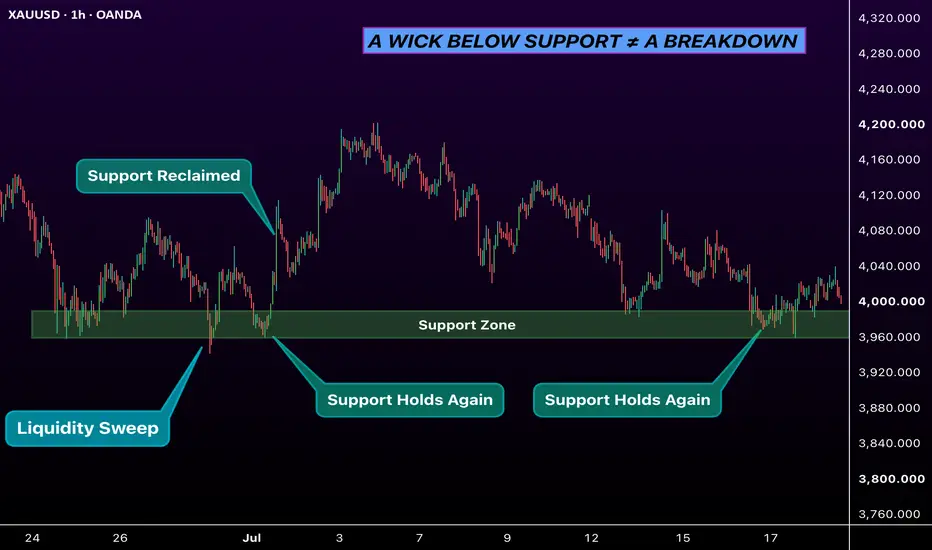
Price traded below the 3,960 support level, but sellers failed to hold the market underneath it. Instead, XAUUSD quickly reclaimed the level and moved higher. 👀
This is an important distinction:
🔻 A wick below support shows that price briefly traded below the level.
✅ A confirmed breakdown requires acceptance below support, preferably with candle closes and a failed retest from underneath.
In this example, the sequence was clear:
🧹 Liquidity sweep — price moved below the previous lows and triggered resting stops.
🔄 Support reclaimed — the candle returned above the level, showing rejection of lower prices.
🛡️ Support held again — the same area produced another reaction later, confirming that traders were still defending the zone.
The key lesson: do not treat every wick below support as a bearish breakout.
Before entering a short position, look for:
📍 A candle close below support
📍 Continued trading below the level
📍 A retest that turns support into resistance
📍 Bearish market structure and follow-through
Without those confirmations, the move may simply be a liquidity grab before price reverses. ⚠️
A wick shows where price travelled. A close shows where the market accepted value.
What do you see here? 🤔
1️⃣ Confirmed breakdown
2️⃣ Liquidity sweep
3️⃣ No trade without confirmation
Share your answer in the comments. 👇
Price traded below the 3,960 support level, but sellers failed to hold the market underneath it. Instead, XAUUSD quickly reclaimed the level and moved higher. 👀
This is an important distinction:
🔻 A wick below support shows that price briefly traded below the level.
✅ A confirmed breakdown requires acceptance below support, preferably with candle closes and a failed retest from underneath.
In this example, the sequence was clear:
🧹 Liquidity sweep — price moved below the previous lows and triggered resting stops.
🔄 Support reclaimed — the candle returned above the level, showing rejection of lower prices.
🛡️ Support held again — the same area produced another reaction later, confirming that traders were still defending the zone.
The key lesson: do not treat every wick below support as a bearish breakout.
Before entering a short position, look for:
📍 A candle close below support
📍 Continued trading below the level
📍 A retest that turns support into resistance
📍 Bearish market structure and follow-through
Without those confirmations, the move may simply be a liquidity grab before price reverses. ⚠️
A wick shows where price travelled. A close shows where the market accepted value.
What do you see here? 🤔
1️⃣ Confirmed breakdown
2️⃣ Liquidity sweep
3️⃣ No trade without confirmation
Share your answer in the comments. 👇

📊 Follow for daily Market Summary, Technical & Fundamental Analysis
👉 t.me/elibrianalytics
👉 t.me/elibrianalytics
Feragatname
Bilgiler ve yayınlar, TradingView tarafından sağlanan veya onaylanan finansal, yatırım, alım satım veya diğer türden tavsiye veya öneriler anlamına gelmez ve teşkil etmez. Kullanım Koşulları bölümünde daha fazlasını okuyun.
📊 Follow for daily Market Summary, Technical & Fundamental Analysis
👉 t.me/elibrianalytics
👉 t.me/elibrianalytics
Feragatname
Bilgiler ve yayınlar, TradingView tarafından sağlanan veya onaylanan finansal, yatırım, alım satım veya diğer türden tavsiye veya öneriler anlamına gelmez ve teşkil etmez. Kullanım Koşulları bölümünde daha fazlasını okuyun.