
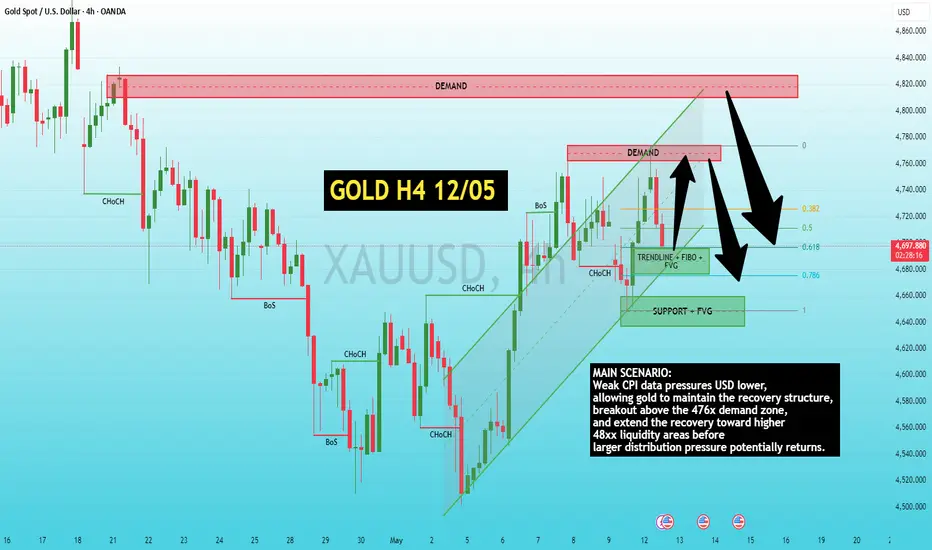
The market is entering tonight’s CPI session in an extremely sensitive state after gold’s strong recovery phase throughout last week. What stands out now is that although gold continues to maintain its short-term bullish recovery structure, momentum is clearly beginning to slow as price repeatedly reacts around the 47xx demand zones. This suggests that large institutional flows have not fully returned into “fear buy” mode like previous crisis phases, while most recent upside movement still appears driven by short-term positioning reacting to economic data and shifting FED expectations.
From a technical perspective, gold is still moving within a short-term bullish trendline structure after forming both CHoCH and BOS from the lower base. However, the current zone is becoming increasingly critical as price repeatedly struggles around upper demand. This is no longer an ideal area for aggressive FOMO buying, but rather a zone to wait for post-CPI confirmation and clearer market direction.
If CPI comes in weaker than expected or markets continue pricing a softer FED stance, USD could weaken in the short term and support gold toward the upper demand zones around 476x–48xx. This remains a major liquidity area where demand, fibo levels, and previous distribution zones converge — making it one of the most important reaction zones for sellers.
On the other hand, if CPI prints hotter than expected or markets shift back toward expectations of higher rates for longer, gold could face a strong rejection from current demand levels and break back below the short-term bullish structure. In that scenario, the 468x–466x support + fibo regions become the first key downside zones to monitor for continuation sell pressure.
MAIN SCENARIO:
Weak CPI data pressures USD lower, allowing gold to maintain the recovery structure, breakout above the 476x demand zone, and extend the recovery toward higher 48xx liquidity areas before larger distribution pressure potentially returns.
ALTERNATIVE SCENARIO:
Strong CPI data strengthens USD, causing gold to reject from current demand, break the H4 bullish trendline, and rotate back toward the 468x–466x support + fibo zones in line with the medium-term bearish bias maintained throughout recent plans.
Overall, tonight’s CPI release could become the defining catalyst for the entire current recovery structure in gold. The market is approaching a highly sensitive price zone where post-news reaction may matter even more than the data itself.
LucasGrayTrading
From a technical perspective, gold is still moving within a short-term bullish trendline structure after forming both CHoCH and BOS from the lower base. However, the current zone is becoming increasingly critical as price repeatedly struggles around upper demand. This is no longer an ideal area for aggressive FOMO buying, but rather a zone to wait for post-CPI confirmation and clearer market direction.
If CPI comes in weaker than expected or markets continue pricing a softer FED stance, USD could weaken in the short term and support gold toward the upper demand zones around 476x–48xx. This remains a major liquidity area where demand, fibo levels, and previous distribution zones converge — making it one of the most important reaction zones for sellers.
On the other hand, if CPI prints hotter than expected or markets shift back toward expectations of higher rates for longer, gold could face a strong rejection from current demand levels and break back below the short-term bullish structure. In that scenario, the 468x–466x support + fibo regions become the first key downside zones to monitor for continuation sell pressure.
MAIN SCENARIO:
Weak CPI data pressures USD lower, allowing gold to maintain the recovery structure, breakout above the 476x demand zone, and extend the recovery toward higher 48xx liquidity areas before larger distribution pressure potentially returns.
ALTERNATIVE SCENARIO:
Strong CPI data strengthens USD, causing gold to reject from current demand, break the H4 bullish trendline, and rotate back toward the 468x–466x support + fibo zones in line with the medium-term bearish bias maintained throughout recent plans.
Overall, tonight’s CPI release could become the defining catalyst for the entire current recovery structure in gold. The market is approaching a highly sensitive price zone where post-news reaction may matter even more than the data itself.
LucasGrayTrading
İşlem aktif
Gold continues to show strong volatility following the CPI news, with a fake breakout below the short-term uptrend structure. After a sharp drop that swept liquidity back to the confluence of support and Fibonacci retracement levels below, the price quickly rebounded by nearly 1000 pips and retested the H4 uptrend trendline.Notably, despite the CPI creating significant volatility pressure, gold has not yet completely broken down the short-term recovery structure. The current downward sweep is more of a liquidity sweep before money flows back to the equilibrium zone above.
Currently, gold is reacting around the uptrend trendline and key Fibonacci levels. If it continues to hold this structure, gold may have another rebound to retest the 47xx demand zones above. Conversely, if a strong rejection occurs around the current trendline, the market could return to a bearish distribution boundary, aligning with the larger macroeconomic bias.

Daily trend & Supply/Demand insights 📊
👉 t.me/+cZC_DmEr3OwzOTA1
High-probability zones & structured setups
Clear scenarios for better decision-making
Trade smarter with LucasGrayTrading 🎖
👉 t.me/+cZC_DmEr3OwzOTA1
High-probability zones & structured setups
Clear scenarios for better decision-making
Trade smarter with LucasGrayTrading 🎖
Feragatname
Bilgiler ve yayınlar, TradingView tarafından sağlanan veya onaylanan finansal, yatırım, alım satım veya diğer türden tavsiye veya öneriler anlamına gelmez ve teşkil etmez. Kullanım Koşulları bölümünde daha fazlasını okuyun.
Daily trend & Supply/Demand insights 📊
👉 t.me/+cZC_DmEr3OwzOTA1
High-probability zones & structured setups
Clear scenarios for better decision-making
Trade smarter with LucasGrayTrading 🎖
👉 t.me/+cZC_DmEr3OwzOTA1
High-probability zones & structured setups
Clear scenarios for better decision-making
Trade smarter with LucasGrayTrading 🎖
Feragatname
Bilgiler ve yayınlar, TradingView tarafından sağlanan veya onaylanan finansal, yatırım, alım satım veya diğer türden tavsiye veya öneriler anlamına gelmez ve teşkil etmez. Kullanım Koşulları bölümünde daha fazlasını okuyun.