
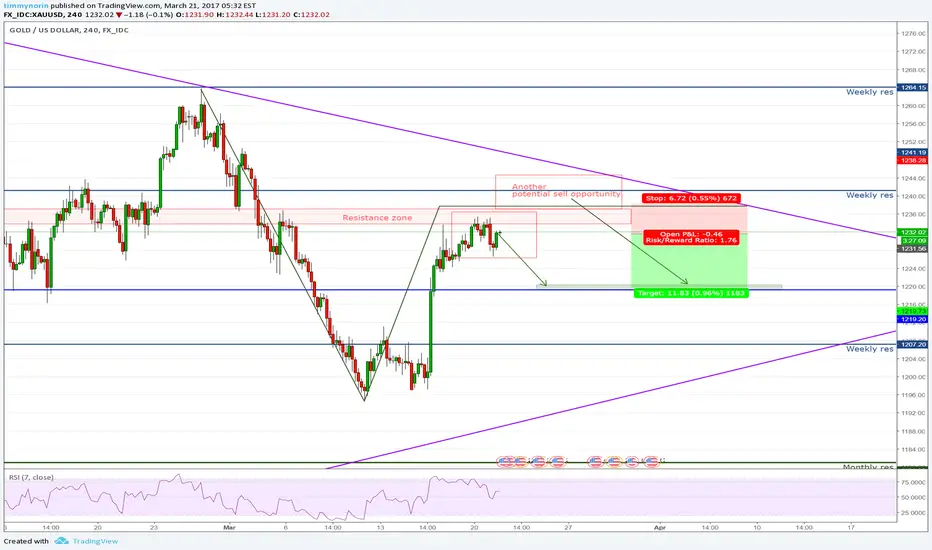
Looking at the 4 hour chart we have found resistance at historically strong support and resistance zone. Price did not manage to close above 1234.00 despite several attempts. Right above us we find a 0.618 fibonacci retracement.
Looking down at the hourly we also see a 2618, a double top (which also can be seen on 4h) followed by a 0.618 retracement after breaking to the downside, passing the "V" point of the double top.
I take this as a first, of two, possible entries to sell. Target 1220.00
Lets see how we do
Looking down at the hourly we also see a 2618, a double top (which also can be seen on 4h) followed by a 0.618 retracement after breaking to the downside, passing the "V" point of the double top.
I take this as a first, of two, possible entries to sell. Target 1220.00
Lets see how we do
İşlem kapandı: durdurma seviyesi
First entry, unsuccessful. I will monitor this since we are now in the second entry zone. If I get signals here, I will enter a new short position, published on a new chart.
Feragatname
Bilgiler ve yayınlar, TradingView tarafından sağlanan veya onaylanan finansal, yatırım, alım satım veya diğer türden tavsiye veya öneriler anlamına gelmez ve teşkil etmez. Kullanım Koşulları bölümünde daha fazlasını okuyun.
Feragatname
Bilgiler ve yayınlar, TradingView tarafından sağlanan veya onaylanan finansal, yatırım, alım satım veya diğer türden tavsiye veya öneriler anlamına gelmez ve teşkil etmez. Kullanım Koşulları bölümünde daha fazlasını okuyun.