
Dear all,
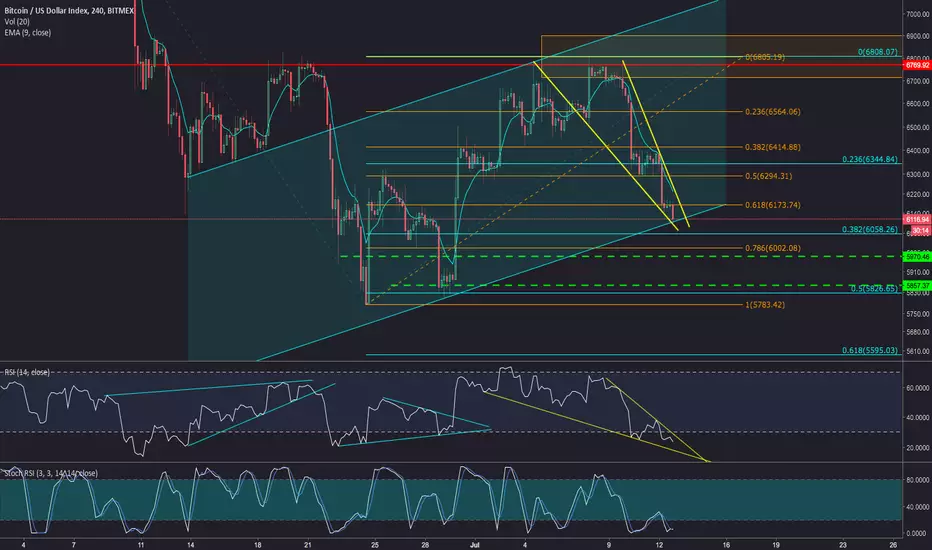
A quick chart on how I am monitoring BTC right now.
I see a lot of bullish signs on this red days, like we shall see a lot of bearish signs after several green days.
- RSI is bottomed
- Stoch RSI double bottom
- Parallel channel support
- Falling wedge
I'm a buyer with tight tight tight stops.
All the Best from the Crypto Space
A quick chart on how I am monitoring BTC right now.
I see a lot of bullish signs on this red days, like we shall see a lot of bearish signs after several green days.
- RSI is bottomed
- Stoch RSI double bottom
- Parallel channel support
- Falling wedge
I'm a buyer with tight tight tight stops.
All the Best from the Crypto Space
İşlem aktif
That was quick :)Not
Upward breakout of the falling wedgeMonitoring BTC reaction to $6,400 with tight stop loss
Not
BTC bouncing on daily with SRSI oversold.
Feragatname
Bilgiler ve yayınlar, TradingView tarafından sağlanan veya onaylanan finansal, yatırım, alım satım veya diğer türden tavsiye veya öneriler anlamına gelmez ve teşkil etmez. Kullanım Koşulları bölümünde daha fazlasını okuyun.
Feragatname
Bilgiler ve yayınlar, TradingView tarafından sağlanan veya onaylanan finansal, yatırım, alım satım veya diğer türden tavsiye veya öneriler anlamına gelmez ve teşkil etmez. Kullanım Koşulları bölümünde daha fazlasını okuyun.