
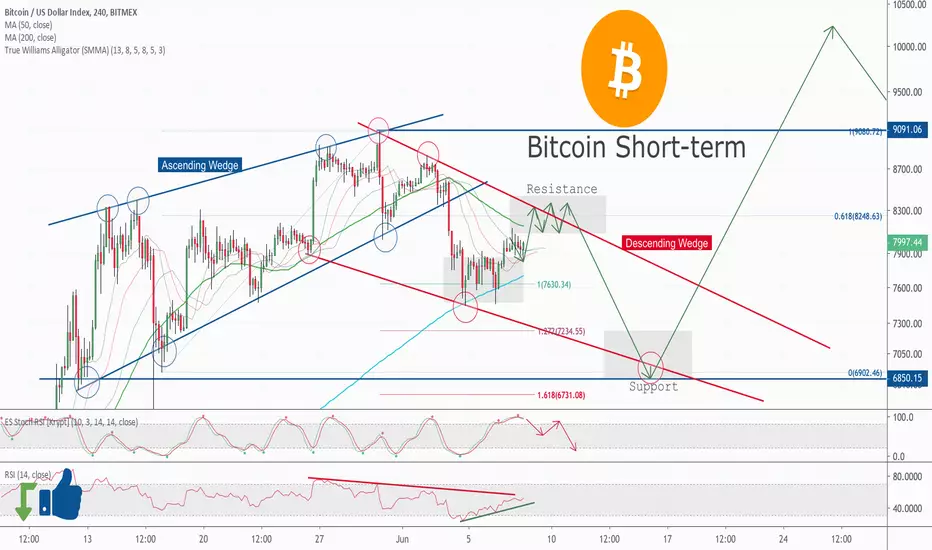
Hello, Artem is back! Here we are on XBT chart, it showing us two types of wedges: Ascending Wedge on the left with dark blue colors, and Descending Wedge on the right with red colors.
Now we in a middle of descending wedge, rebounding from dynamic support *7600$ and going to resistance area of 0.618 Fib at around 8250$.
Stochastic RSI already topped and looks like I will make lower high, while price will hit higher to 8250$ to complete local bearish divergence. So this will be our signal for rebound and reentry for longs I expect around 6800$ support level.
If something will opposite to this idea we should be ready, so our bullish breakout should be supported by breaking out from 9000$ level. Bearish breakout should be supported by 6800$ breakdown.
Good luck and feel free to share your ideas to make any contribution to this analysis.
Now we in a middle of descending wedge, rebounding from dynamic support *7600$ and going to resistance area of 0.618 Fib at around 8250$.
Stochastic RSI already topped and looks like I will make lower high, while price will hit higher to 8250$ to complete local bearish divergence. So this will be our signal for rebound and reentry for longs I expect around 6800$ support level.
If something will opposite to this idea we should be ready, so our bullish breakout should be supported by breaking out from 9000$ level. Bearish breakout should be supported by 6800$ breakdown.
Good luck and feel free to share your ideas to make any contribution to this analysis.

Feragatname
Bilgiler ve yayınlar, TradingView tarafından sağlanan veya onaylanan finansal, yatırım, alım satım veya diğer türden tavsiye veya öneriler anlamına gelmez ve teşkil etmez. Kullanım Koşulları bölümünde daha fazlasını okuyun.
Feragatname
Bilgiler ve yayınlar, TradingView tarafından sağlanan veya onaylanan finansal, yatırım, alım satım veya diğer türden tavsiye veya öneriler anlamına gelmez ve teşkil etmez. Kullanım Koşulları bölümünde daha fazlasını okuyun.