Alış
XEM Go Long: Triple Bottom Formation
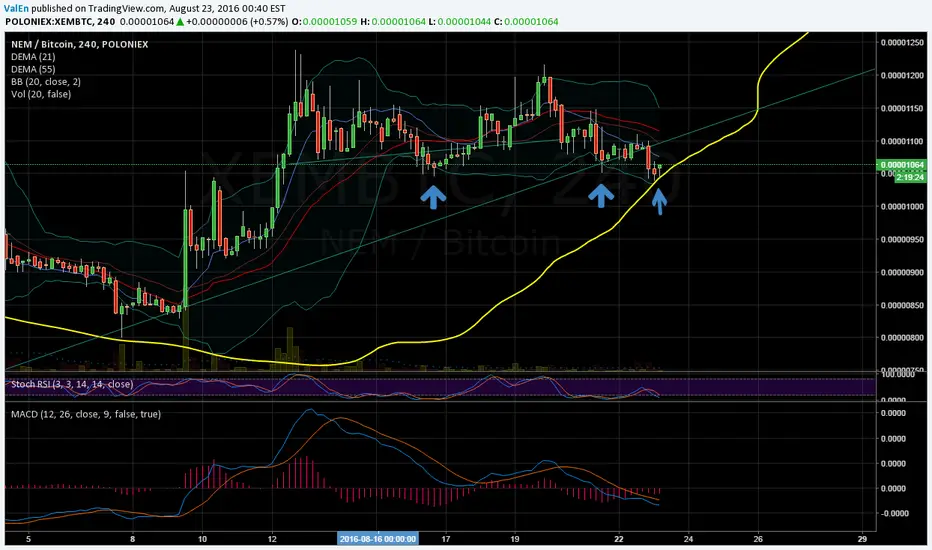
As the Triple Bottom Reversal develops, it can start to resemble a number of patterns. Before the third low forms, the pattern may look like a Double Bottom Reversal. Three equal lows can also be found in a descending triangle or rectangle. Of these patterns mentioned, only the descending triangle has bearish overtones; the others are neutral until a breakout occurs. Similarly, the Triple Bottom Reversal should also be treated as a neutral pattern until a breakout occurs. The ability to hold support is bullish, but demand has not won the battle until resistance is broken. Volume on the last advance can sometimes yield a clue. If there is a sharp increase in volume and momentum, then the chances of a breakout increase.
Source:stockcharts.com/school/doku.php?id=chart_school:chart_analysis:chart_patterns:triple_bottom_reversal
Source:stockcharts.com/school/doku.php?id=chart_school:chart_analysis:chart_patterns:triple_bottom_reversal

İlgili yayınlar
Feragatname
Bilgiler ve yayınlar, TradingView tarafından sağlanan veya onaylanan finansal, yatırım, alım satım veya diğer türden tavsiye veya öneriler anlamına gelmez ve teşkil etmez. Kullanım Koşulları bölümünde daha fazlasını okuyun.
İlgili yayınlar
Feragatname
Bilgiler ve yayınlar, TradingView tarafından sağlanan veya onaylanan finansal, yatırım, alım satım veya diğer türden tavsiye veya öneriler anlamına gelmez ve teşkil etmez. Kullanım Koşulları bölümünde daha fazlasını okuyun.