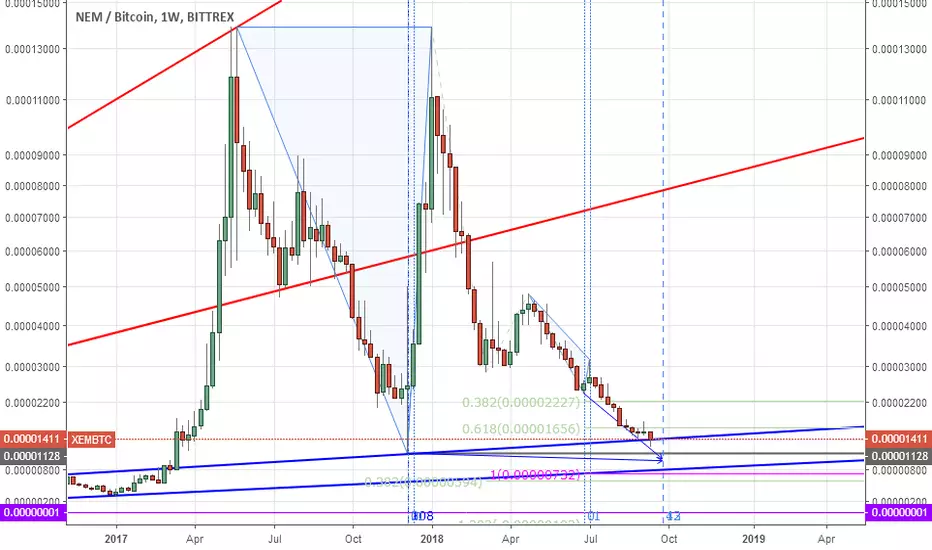
showing here the same possible reversal week 24-30 September. Ermanometry in case of XEM does not work however so precise in comparison to BTCUSD weekly chart (after all time high made by Bitcoin - before that time ermanometric calculations seem not to work properly). But XEMBTC chart suggests possible nearing of ending this bear market here. Some spike up should be drawed by market forces here. The only question is when.
Not
XEMUSD have one week eralier his ermanometric, turning point. That from 13 August gave limited effect.
İlgili yayınlar
Feragatname
Bilgiler ve yayınlar, TradingView tarafından sağlanan veya onaylanan finansal, yatırım, alım satım veya diğer türden tavsiye veya öneriler anlamına gelmez ve teşkil etmez. Kullanım Koşulları bölümünde daha fazlasını okuyun.
Feragatname
Bilgiler ve yayınlar, TradingView tarafından sağlanan veya onaylanan finansal, yatırım, alım satım veya diğer türden tavsiye veya öneriler anlamına gelmez ve teşkil etmez. Kullanım Koşulları bölümünde daha fazlasını okuyun.