
Hello guys,
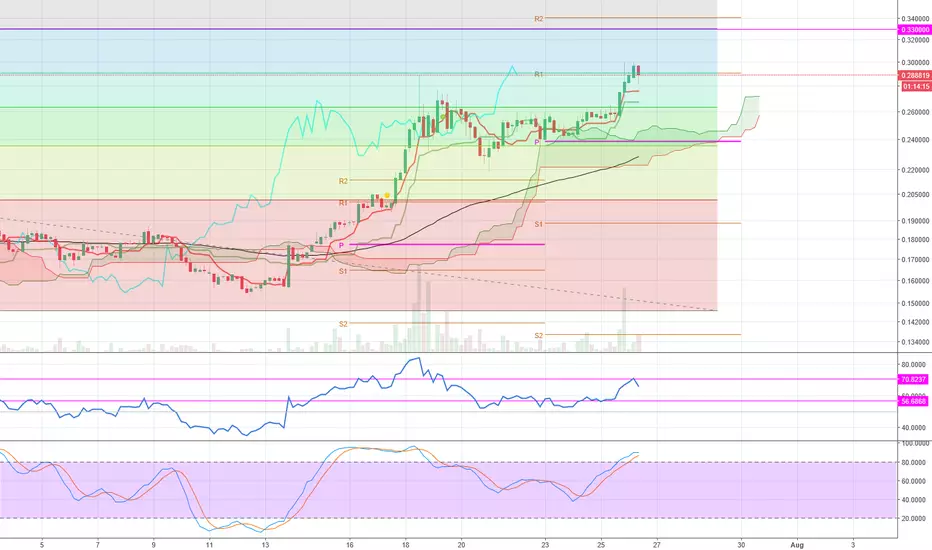
XLM Chart :
- We hit R1 weekly on H4 chart
- Little pullback on the RSI (21) 70%
- We need to have a signal from a bullish candlestick + break 70% rsi to have a bullish Momentum to go to the weekly R2 and next fibonacci level (0.33€) for a take profit !
Be patient, we need to have a new bullish signal for the next take profit !
XLM Chart :
- We hit R1 weekly on H4 chart
- Little pullback on the RSI (21) 70%
- We need to have a signal from a bullish candlestick + break 70% rsi to have a bullish Momentum to go to the weekly R2 and next fibonacci level (0.33€) for a take profit !
Be patient, we need to have a new bullish signal for the next take profit !

Feragatname
Bilgiler ve yayınlar, TradingView tarafından sağlanan veya onaylanan finansal, yatırım, alım satım veya diğer türden tavsiye veya öneriler anlamına gelmez ve teşkil etmez. Kullanım Koşulları bölümünde daha fazlasını okuyun.
Feragatname
Bilgiler ve yayınlar, TradingView tarafından sağlanan veya onaylanan finansal, yatırım, alım satım veya diğer türden tavsiye veya öneriler anlamına gelmez ve teşkil etmez. Kullanım Koşulları bölümünde daha fazlasını okuyun.