
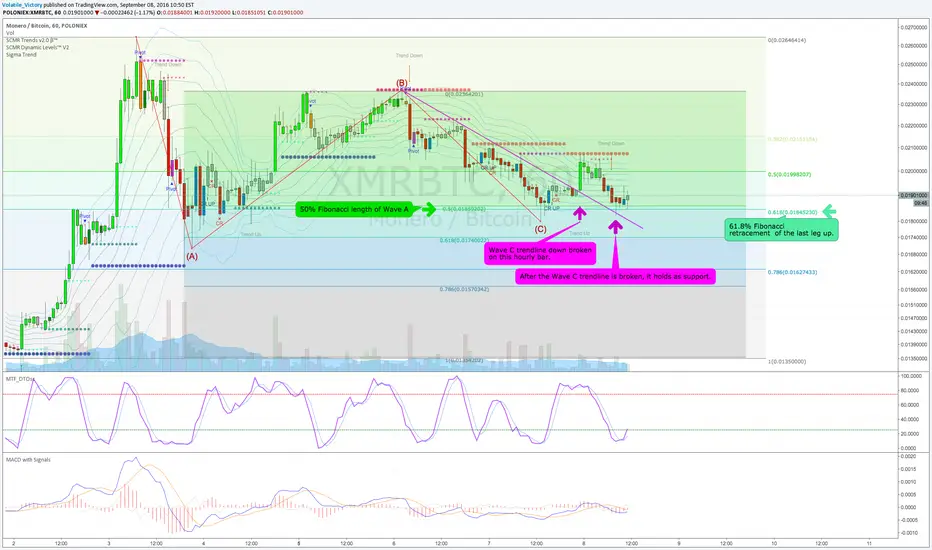
All signs point to the XMRBTC correction being over:
1. Notice the ABC wave correction.
2. Wave C is equal to Wave A which is a common length of a Wave C to Wave A.
3. Wave C retraced back 61.8% of the previous impulsive leg up.
4. The Wave C trendline was broken on Sept 7th at 03:00 UTC (23:00 EST on graph).
5. The Wave C trendline, after being broken, held as resistance at 12:00 UTC (08:00 EST on graph)
All of those signals point to the last move off the ATH as being a temporary correction and that we can expect another move higher. I would go LONG XMRBTC and place a stop at 0.0180. If when the next hourly RSI is rolling over and we have not significantly pushed past at least 0.0220 then I would be concerned that another pattern may be playing out instead of an immediate push to a new ATH.

Feragatname
Bilgiler ve yayınlar, TradingView tarafından sağlanan veya onaylanan finansal, yatırım, alım satım veya diğer türden tavsiye veya öneriler anlamına gelmez ve teşkil etmez. Kullanım Koşulları bölümünde daha fazlasını okuyun.
Feragatname
Bilgiler ve yayınlar, TradingView tarafından sağlanan veya onaylanan finansal, yatırım, alım satım veya diğer türden tavsiye veya öneriler anlamına gelmez ve teşkil etmez. Kullanım Koşulları bölümünde daha fazlasını okuyun.